Free Access
Fig. 7
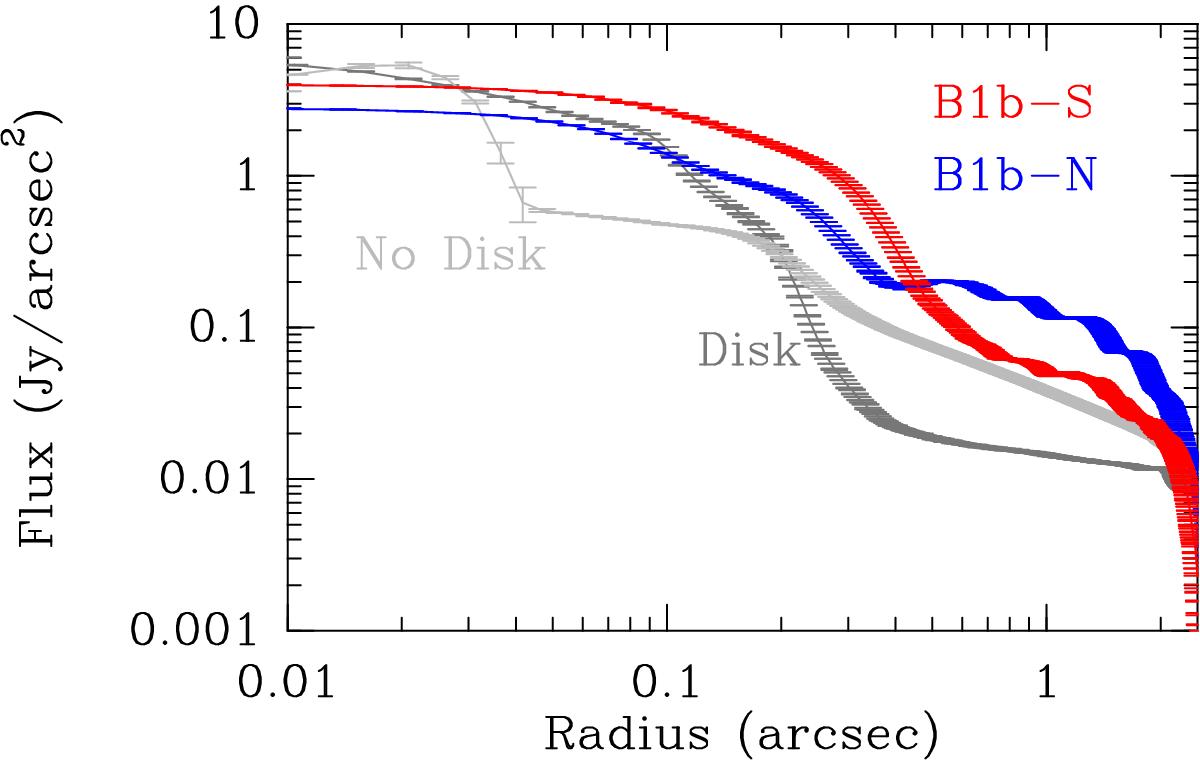
Comparison of the radially averaged flux distribution for B1b-S (red), B1b-N (blue), and two different epochs of the MHD collapse model. The light gray curve labeled “No Disk” shows an early epoch before the formation of the FHSC, while the darker gray curve labeled “Disk” shows the later time illustrated in Figs. 5 and 6.
Current usage metrics show cumulative count of Article Views (full-text article views including HTML views, PDF and ePub downloads, according to the available data) and Abstracts Views on Vision4Press platform.
Data correspond to usage on the plateform after 2015. The current usage metrics is available 48-96 hours after online publication and is updated daily on week days.
Initial download of the metrics may take a while.