Fig. 4
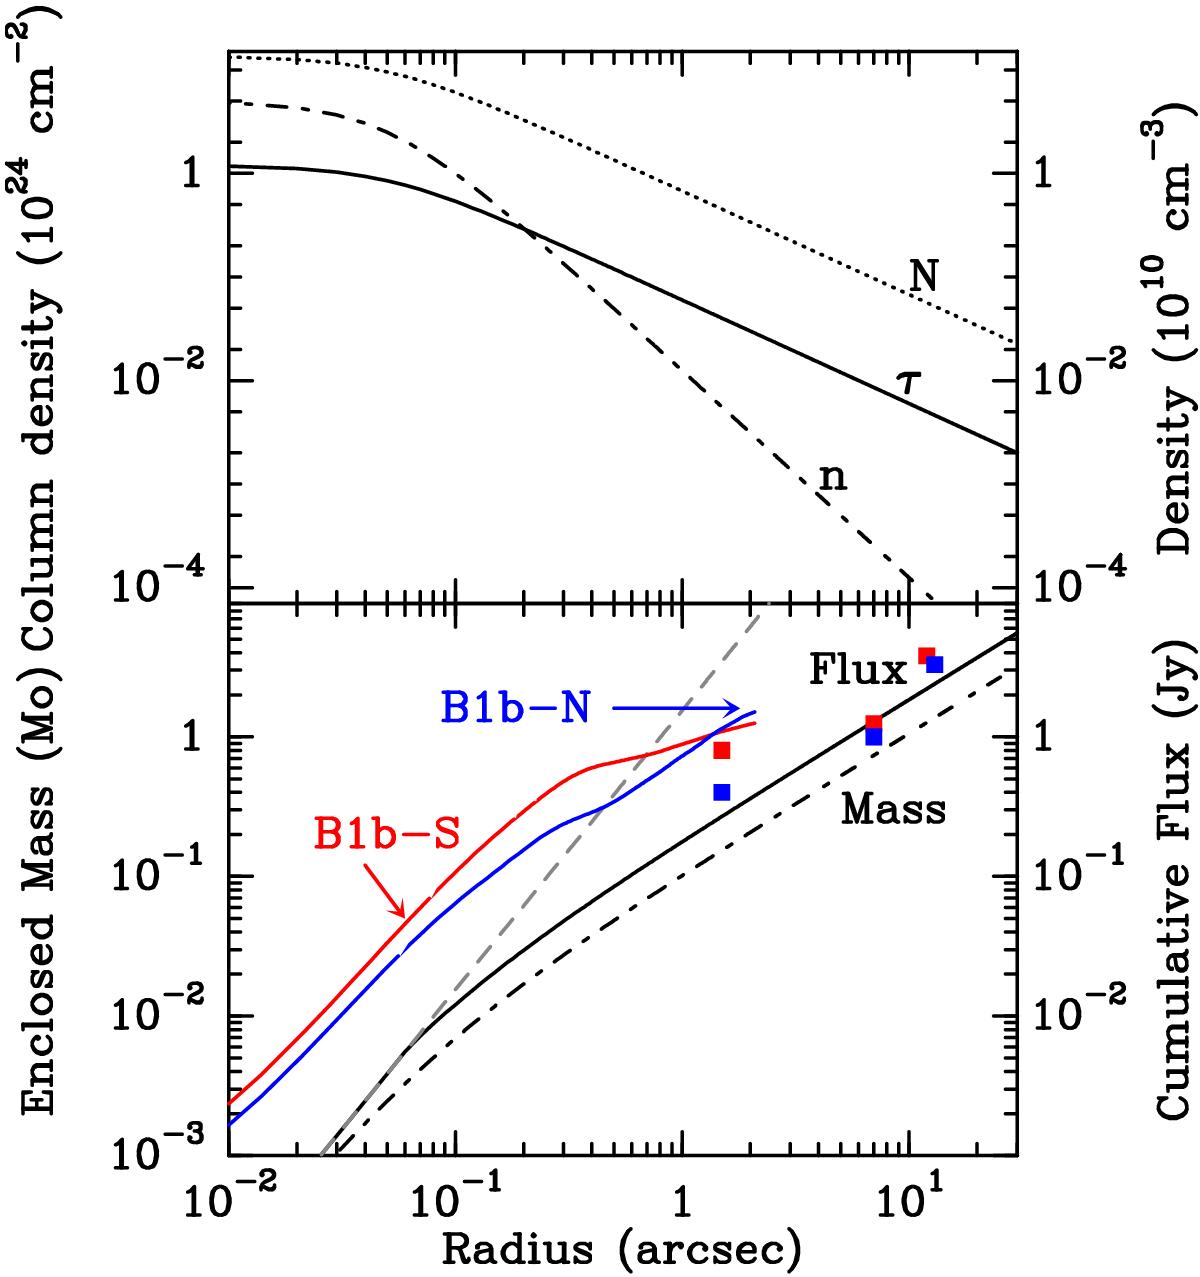
Top panel: variation with radius of the molecular hydrogen density, n (dash-dotted line), the column density, N (dotted line), and the resulting continuum opacity at 350 GHz, τ (solid line) for a simple spherical isothermal (12 K) core model. Bottom panel: variation of the gas mass (dash-dotted line) and 350 GHz flux (solid line) as a function of radius for the model displayed in the top panel. The dashed gray line shows the expected cumulative flux distribution for a pure blackbody (optically thick emission) at the same temperature. The observed data toward B1b-N and B1b-S are displayed in blue and red, respectively, including the ALMA data from 0.05′′ to 3′′ and JCMT and SMA data between 3′′ and 12′′ (Pezzuto et al. 2012; Hirano & Liu 2014; I-Hsiu Li et al. 2017).
Current usage metrics show cumulative count of Article Views (full-text article views including HTML views, PDF and ePub downloads, according to the available data) and Abstracts Views on Vision4Press platform.
Data correspond to usage on the plateform after 2015. The current usage metrics is available 48-96 hours after online publication and is updated daily on week days.
Initial download of the metrics may take a while.