Fig. 3
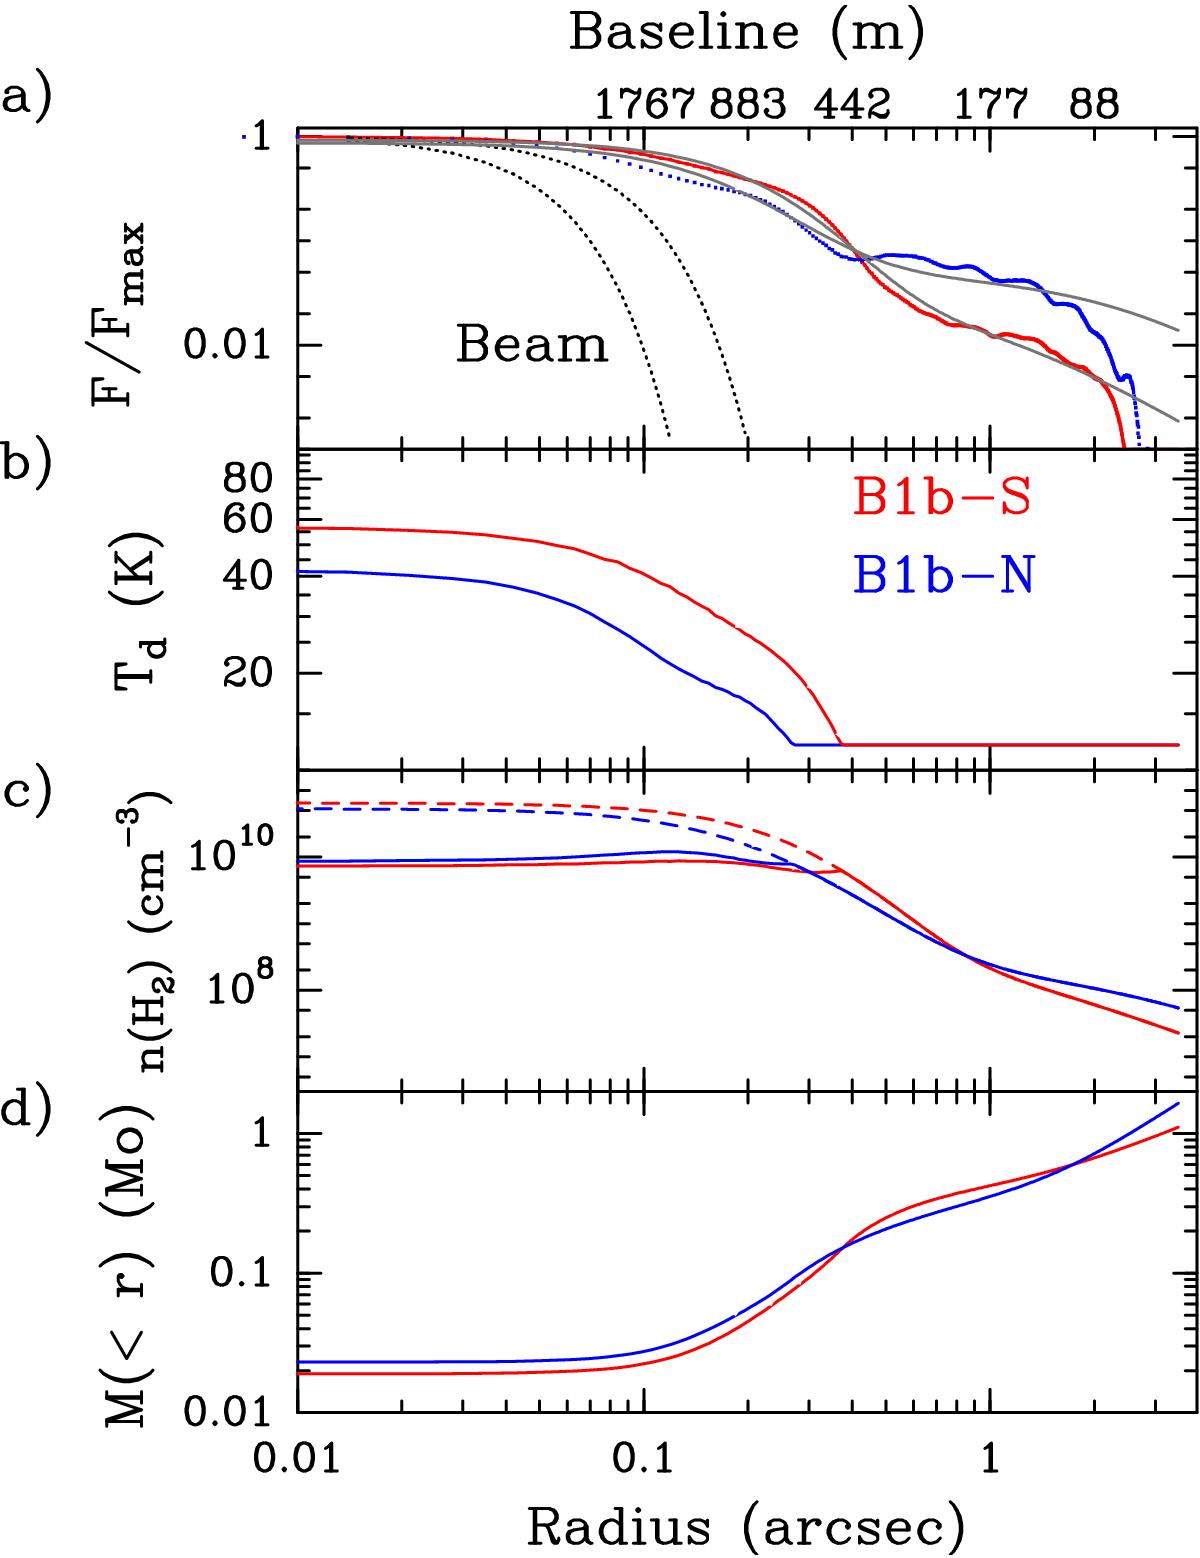
Panel a: distribution of the circularly averaged specific intensity normalized to the peak value as a function of radius toward B1b-S and B1b-N. The gray lines show the analytical fits and the dotted lines the beam profiles. The upper scale presents the baseline in meters corresponding to the angular scale. Data for B1b-N are displayed in blue and data for B1b-S in red. Panel b: dust temperature (Td) radial distribution, assuming that the 350 GHz emission is optically thick, with a minimum value set to 12 K. Panel c: molecular hydrogen density, using the derived Td and assuming optically thin emission. This represents a lower limit to the real density. The dashed lines show the densities, assuming a constant value of the dust temperature. Panel d: cumulative mass distribution obtained by combining the information at 350 and 32 GHz.
Current usage metrics show cumulative count of Article Views (full-text article views including HTML views, PDF and ePub downloads, according to the available data) and Abstracts Views on Vision4Press platform.
Data correspond to usage on the plateform after 2015. The current usage metrics is available 48-96 hours after online publication and is updated daily on week days.
Initial download of the metrics may take a while.