Fig. 2
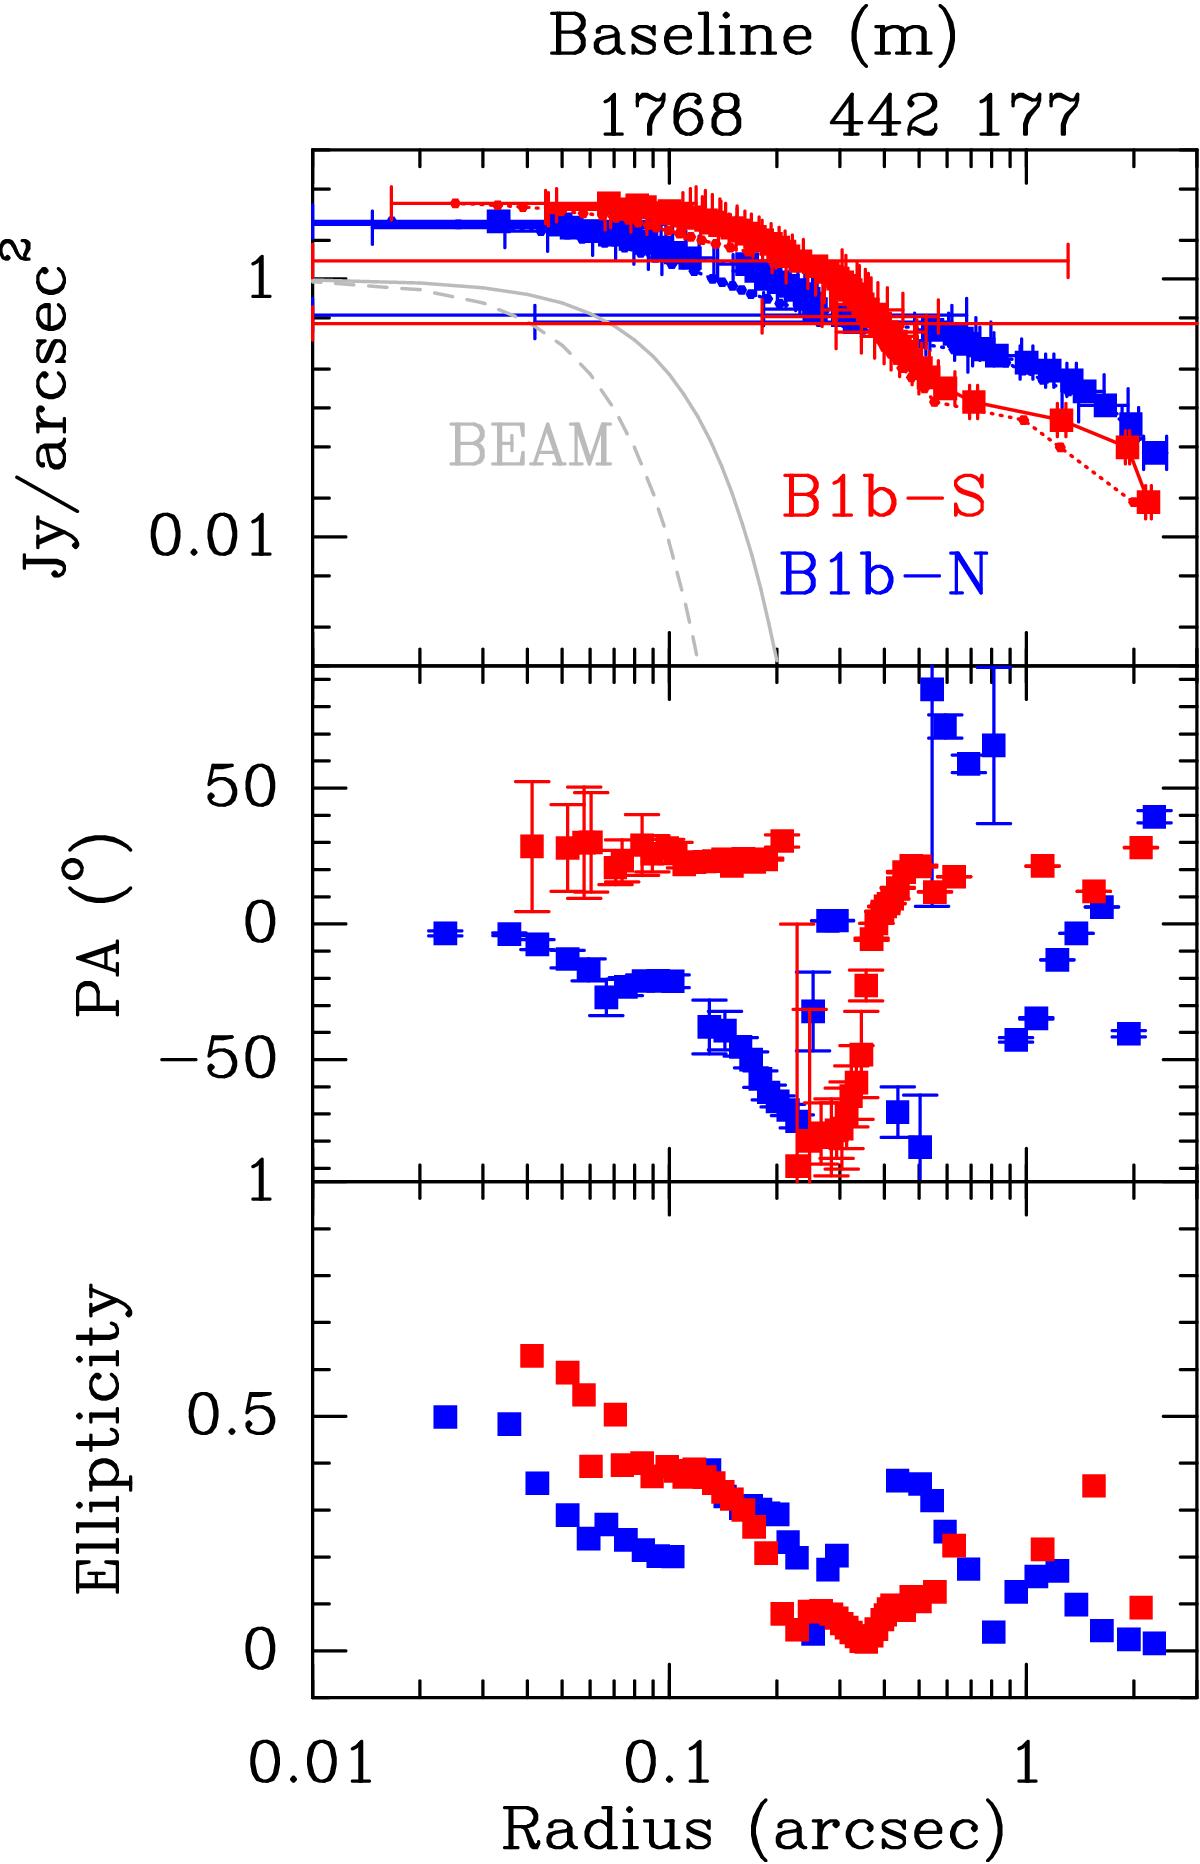
Fit parameters of intensity isocontours using ellipses. B1b-N data are shown in blue and B1b-S data in red. The top panel presents the variation of the major and minor axis sizes. The middle panel shows the ellipse position angle, PA, and the bottom panel the ellipticity, e = 1 − Rmin/Rmaj. The beam profiles are displayed in the top panel. The beam position angles and ellipticities are 1.1° and 0.2 for B1b-N and 16° and 0.21 for B1b-S. The upper scale displays the correspondence between antenna baseline and angular scale.
Current usage metrics show cumulative count of Article Views (full-text article views including HTML views, PDF and ePub downloads, according to the available data) and Abstracts Views on Vision4Press platform.
Data correspond to usage on the plateform after 2015. The current usage metrics is available 48-96 hours after online publication and is updated daily on week days.
Initial download of the metrics may take a while.