Fig. 1
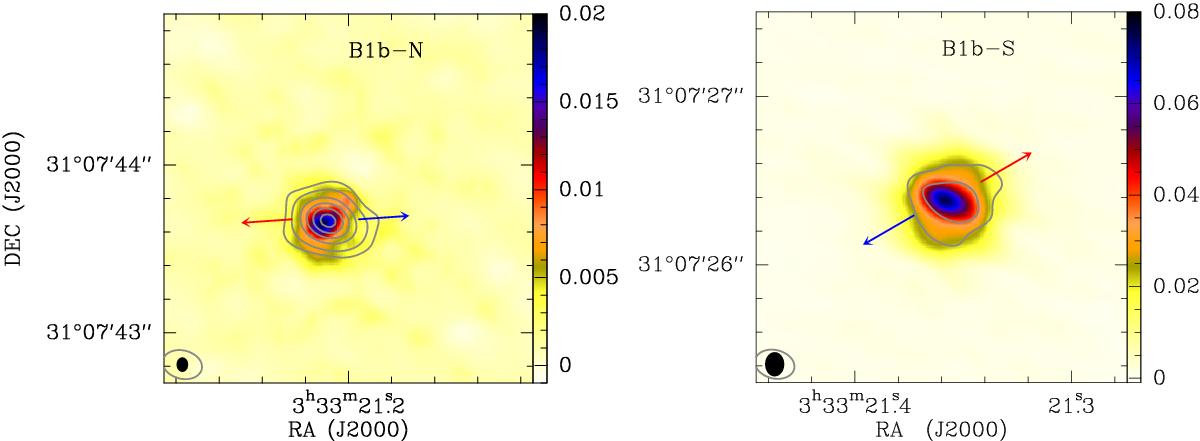
Continuum emission at 349 GHz toward B1b-N (left) and B1b-S (right). The gray contours show the 32 GHz continuum emission from the VANDAM survey (Tobin et al. 2015, 2016) and are drawn at 0.05, 0.1, 0.2, 0.3, 0.4, and 0.5 mJy/beam. The ALMA and VLA beam sizes are shown as black and gray ellipses. The red and blue arrows show the approximate direction of the outflows.
Current usage metrics show cumulative count of Article Views (full-text article views including HTML views, PDF and ePub downloads, according to the available data) and Abstracts Views on Vision4Press platform.
Data correspond to usage on the plateform after 2015. The current usage metrics is available 48-96 hours after online publication and is updated daily on week days.
Initial download of the metrics may take a while.