Fig. 8
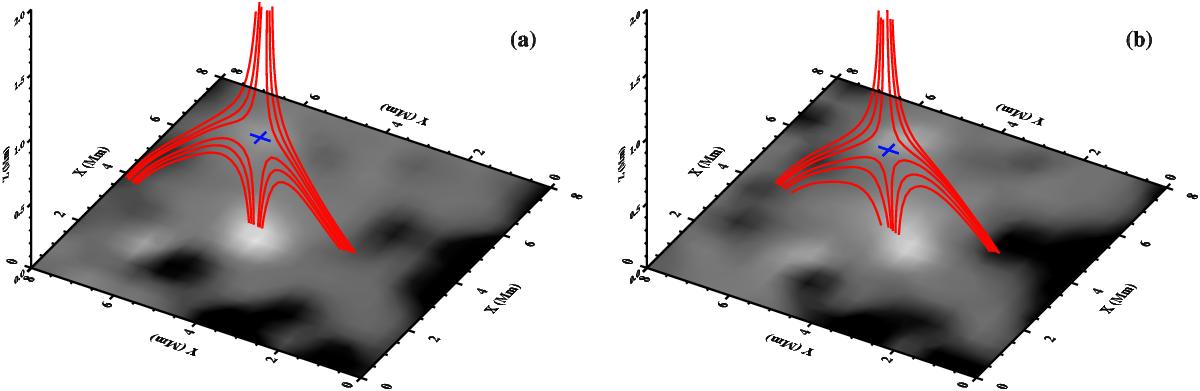
Evolution of the persistent fan-spine magnetic topology (selected field lines plotted in red) and the associated magnetic null (blue cross, at a height of about 500 km above z = 0), surrounding the observed UV burst. In each panel, the gray scale image shows the line-of-sight magnetic field map saturated at ±250 G. It covers the spatial extent outlined by the yellow box in Fig. 7. Panel a is obtained at 20:37 UT, and panel b at 21:00 UT. The field lines are plotted only up to a height of 2 Mm. The z-axis is stretched for display purposes. See Sects. 3.2 and 3.3.
Current usage metrics show cumulative count of Article Views (full-text article views including HTML views, PDF and ePub downloads, according to the available data) and Abstracts Views on Vision4Press platform.
Data correspond to usage on the plateform after 2015. The current usage metrics is available 48-96 hours after online publication and is updated daily on week days.
Initial download of the metrics may take a while.