Fig. 6
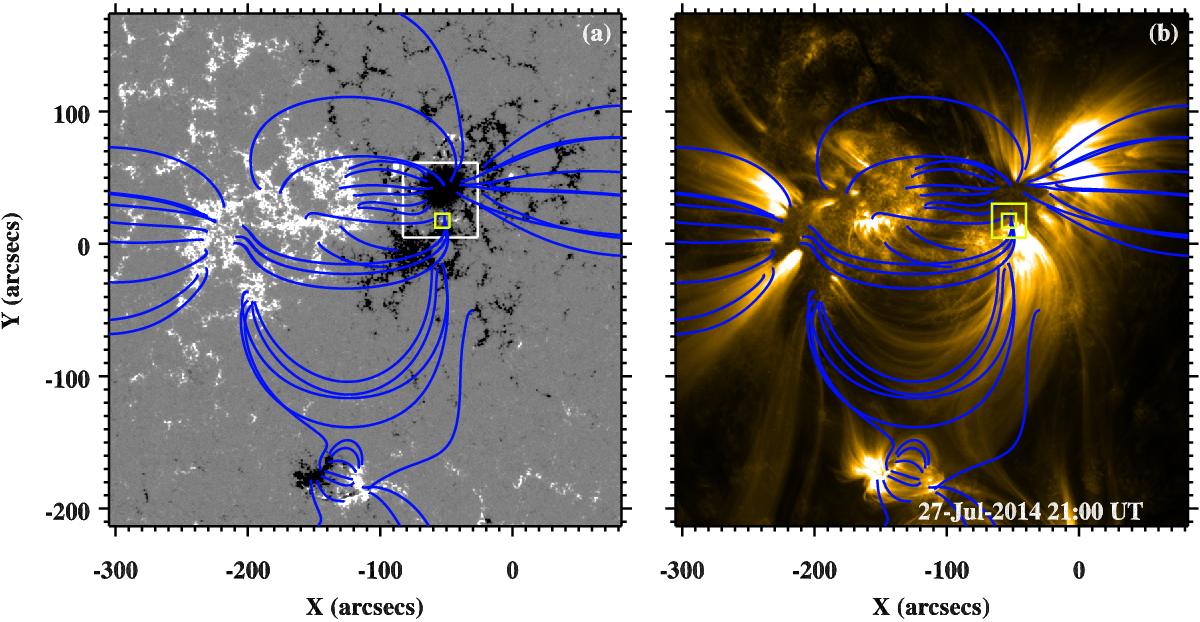
Larger magnetic environment surrounding the UV burst. Panel a shows the map of the SDO/HMI line-of-sight magnetic field saturated at ±250 G. Panel b presents the EUV emission observed with the AIA 171 Å channel showing several coronal loops. Overlaid in blue on both panels are selected field lines derived from a nonlinear force-free field model evolved with a magnetofrictional relaxation method. The larger white box in panel a marks the field of view plotted in Figs. 1 and 7. The smaller yellow box in the two panels is the location of the UV burst observed with IRIS (yellow box in Fig. 7, see also Fig. 2). The larger yellow box in panel b marks the field of view shown in the top panel of Fig. 10. See Sect. 3.2.
Current usage metrics show cumulative count of Article Views (full-text article views including HTML views, PDF and ePub downloads, according to the available data) and Abstracts Views on Vision4Press platform.
Data correspond to usage on the plateform after 2015. The current usage metrics is available 48-96 hours after online publication and is updated daily on week days.
Initial download of the metrics may take a while.