Fig. 5
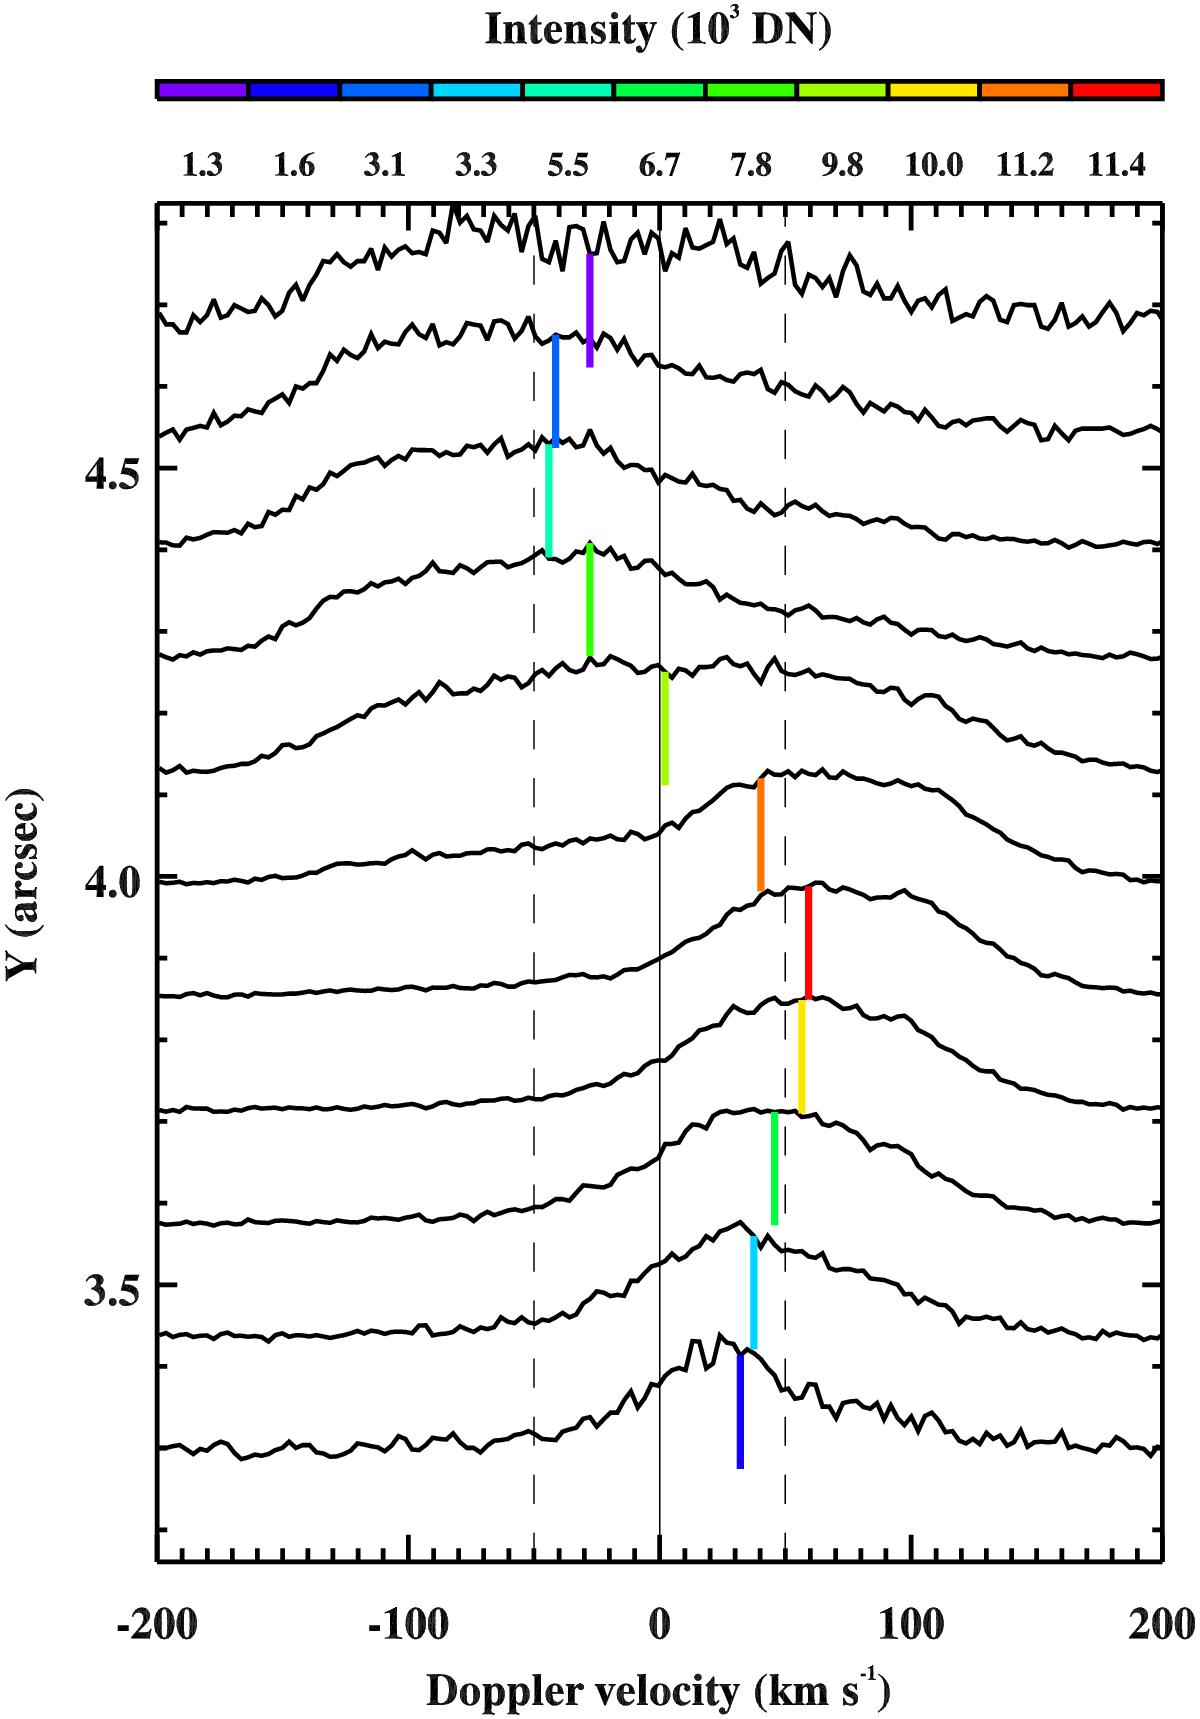
Si iv spectral profiles observed along the vertical line in Fig. 4. Each spectrum is normalised to its maximum and shifted in y-direction by a constant amount to create this stack plot. The y-axis indicates the spatial extent along the vertical line in Fig. 4. The coloured vertical bars associated with each spectrum show the position of the intensity-weighted Doppler shift of the line, while the colour of the bar indicates the line intensity, according to the colour bar above the plot. Vertical lines indicate zero and ±50 km s-1 Doppler shifts. See Sect. 2.3.
Current usage metrics show cumulative count of Article Views (full-text article views including HTML views, PDF and ePub downloads, according to the available data) and Abstracts Views on Vision4Press platform.
Data correspond to usage on the plateform after 2015. The current usage metrics is available 48-96 hours after online publication and is updated daily on week days.
Initial download of the metrics may take a while.