Fig. 4
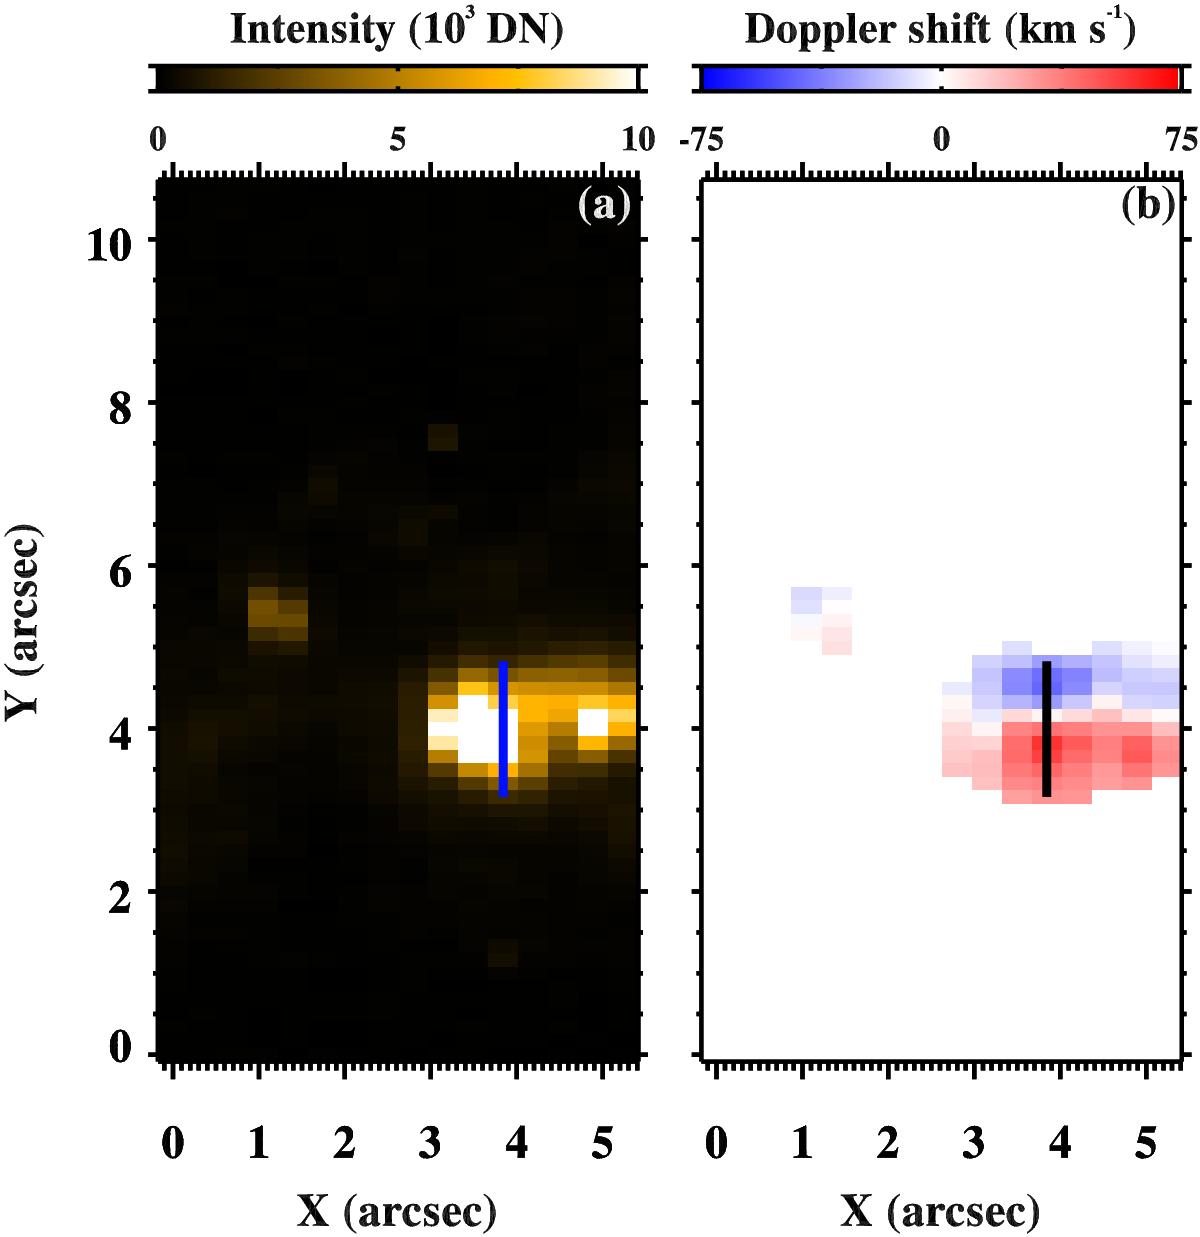
Maps of the transition region intensity and Doppler shifts from the Si iv 1403 Å line, obtained at 21:02 UT, associated with the compact UV burst. Panel a shows the spatial distribution of the Si iv 1403 Å line integrated intensity within ±200 km s-1 from its zero-Doppler shift. Panel b shows the map of an intensity-weighted Doppler shift of the same spectral line, saturated at ± 75 km s-1. The vertical lines in the panels show the location along which several spectral profiles are displayed in Fig. 5. The temporal evolution of the intensity and Doppler-shift maps is available as an online movie. See Sect. 2.3.
Current usage metrics show cumulative count of Article Views (full-text article views including HTML views, PDF and ePub downloads, according to the available data) and Abstracts Views on Vision4Press platform.
Data correspond to usage on the plateform after 2015. The current usage metrics is available 48-96 hours after online publication and is updated daily on week days.
Initial download of the metrics may take a while.