Fig. 3
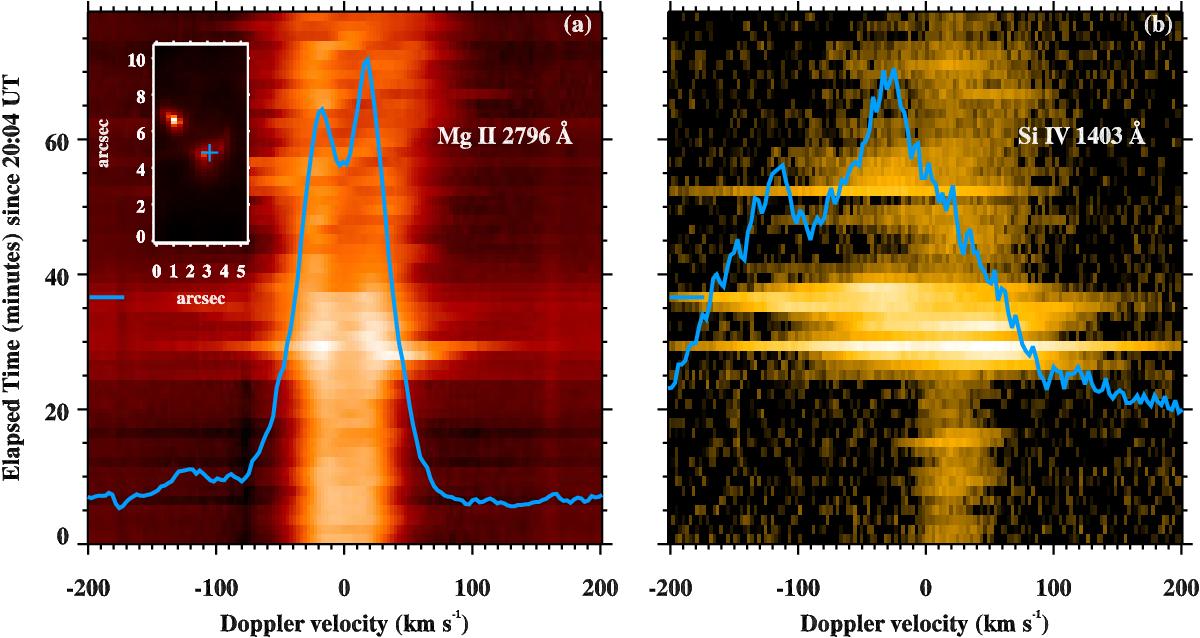
Samples of spectral profiles from the solar chromosphere and transition region at the site of the UV burst. In panel a, the background image is a Mg ii λ−t plot (in Doppler units) near 2796 Å, obtained from the spatial location marked by a plus in the inset. Here the inset shows a sub-field of view of the raster map at the mark of 37 min (indicated by a small horizontal blue bar). The blue curve is the Mg ii line profile at that instance. Panel b is the same as panel a, but plotted for the Si iv 1403 Å line that traces the solar transition region. See Sect. 2.2.
Current usage metrics show cumulative count of Article Views (full-text article views including HTML views, PDF and ePub downloads, according to the available data) and Abstracts Views on Vision4Press platform.
Data correspond to usage on the plateform after 2015. The current usage metrics is available 48-96 hours after online publication and is updated daily on week days.
Initial download of the metrics may take a while.