Fig. 10
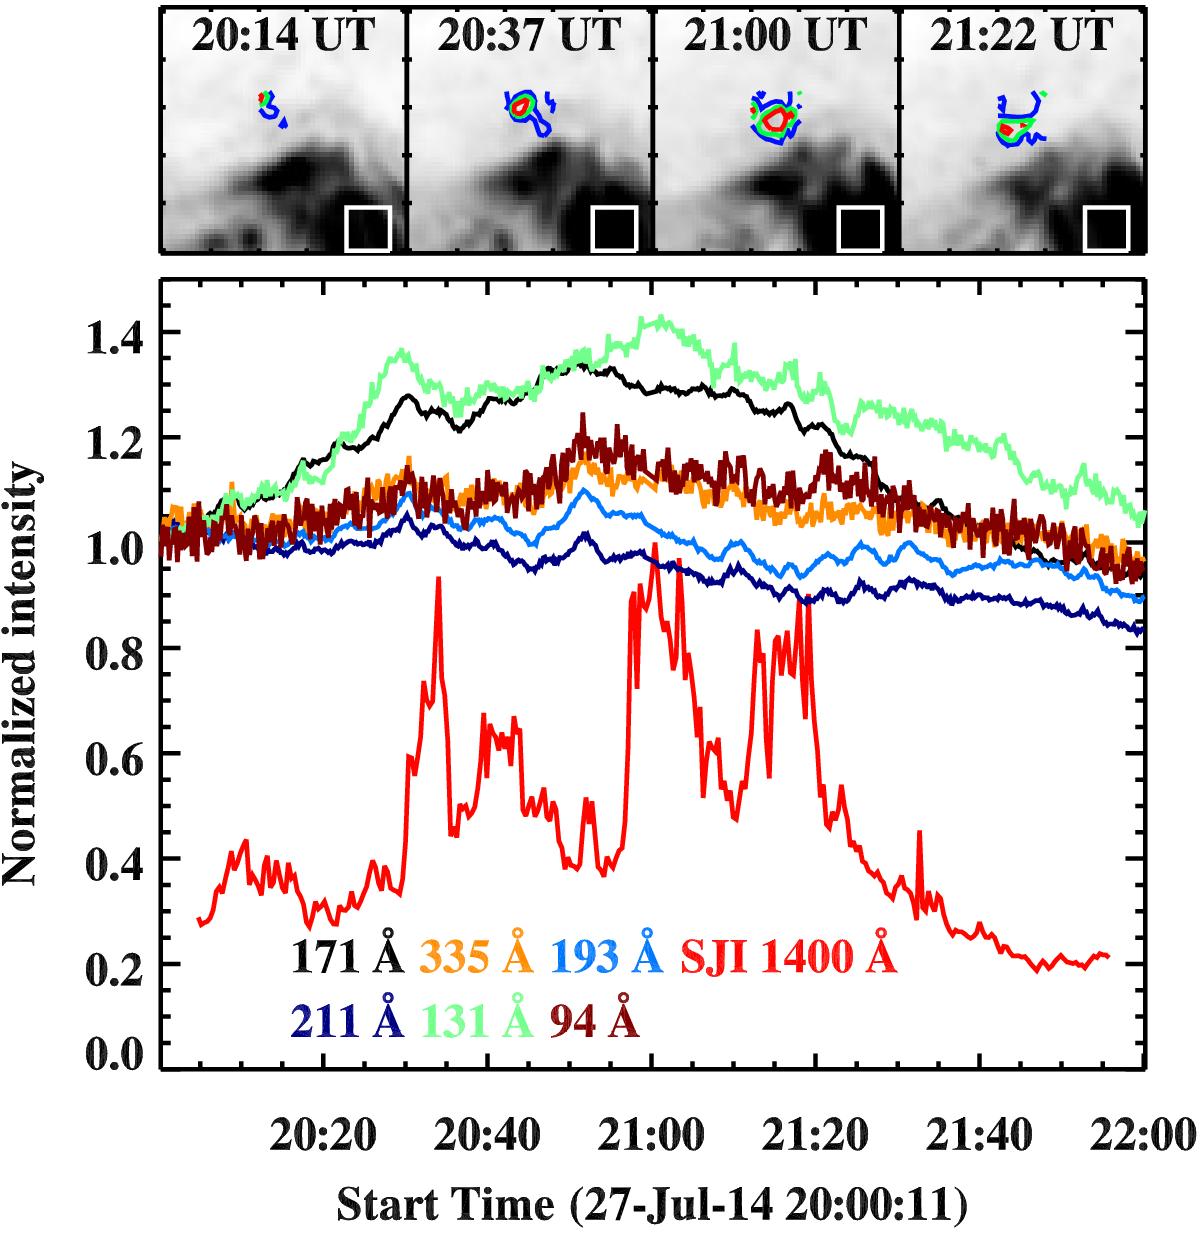
Evolution of EUV emission at the footpoints of coronal loops in the vicinity of the UV burst as recorded by AIA and the UV burst as seen in IRIS SJI 1400 Å images. The top panel shows a series of AIA 171 Å snapshots (in negative scale) within the larger yellow box plotted in Fig. 6b, which covers an area of 26′′×26′′. The white box in each tile indicates the location of the coronal loop footpoints. The contour lines highlight the location of the UV burst in the same way as shown in Fig. 2. In the bottom panel we plot AIA and IRIS SJI light curves. Here each AIA light curve is the average emission from the region outlined by the white box in the top panel. These AIA light curves are background subtracted and normalised to the respective intensities at their start times. The SJI intensity is normalised to its maximum value. The same SJI light curve is also plotted in Fig. 2. See Sect. 4.
Current usage metrics show cumulative count of Article Views (full-text article views including HTML views, PDF and ePub downloads, according to the available data) and Abstracts Views on Vision4Press platform.
Data correspond to usage on the plateform after 2015. The current usage metrics is available 48-96 hours after online publication and is updated daily on week days.
Initial download of the metrics may take a while.