Fig. 1
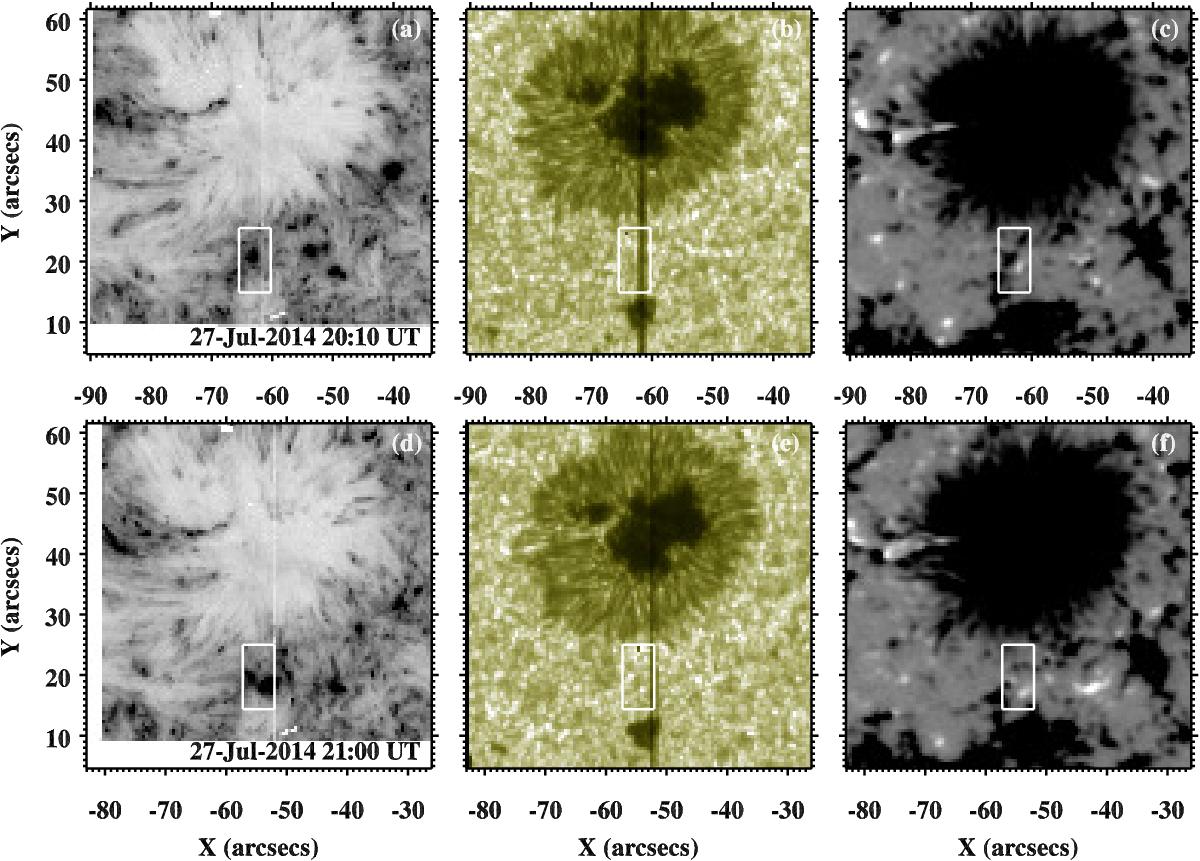
Spatial evolution of a compact UV burst and the surrounding magnetic environment as seen with IRIS and SDO/HMI. Panels a and d show two SJI 1400 Å images separated by 50 min that mainly outline chromospheric and transition region features. Panels b and e show co-temporal SJI 2832 Å images displaying photospheric granulation. Co-temporal HMI line-of-sight magnetic field maps saturated at ± 250 G are plotted in panels c and f. The location of the compact UV burst is outlined by a white box in all the panels. Here the white box marks the sub-field of view of raster maps we used for the more detailed investigation. This sub-field of view is shown as an inset map in the left panel of Fig. 3 and in the two panels of Fig. 4. The two SJI 1400 Å images are the negatives of the square-root-scaled intensity. The vertical lines in panels b and e show the locations of the slit positions at these times. See Sect. 2.1.
Current usage metrics show cumulative count of Article Views (full-text article views including HTML views, PDF and ePub downloads, according to the available data) and Abstracts Views on Vision4Press platform.
Data correspond to usage on the plateform after 2015. The current usage metrics is available 48-96 hours after online publication and is updated daily on week days.
Initial download of the metrics may take a while.