Free Access
Fig. 14
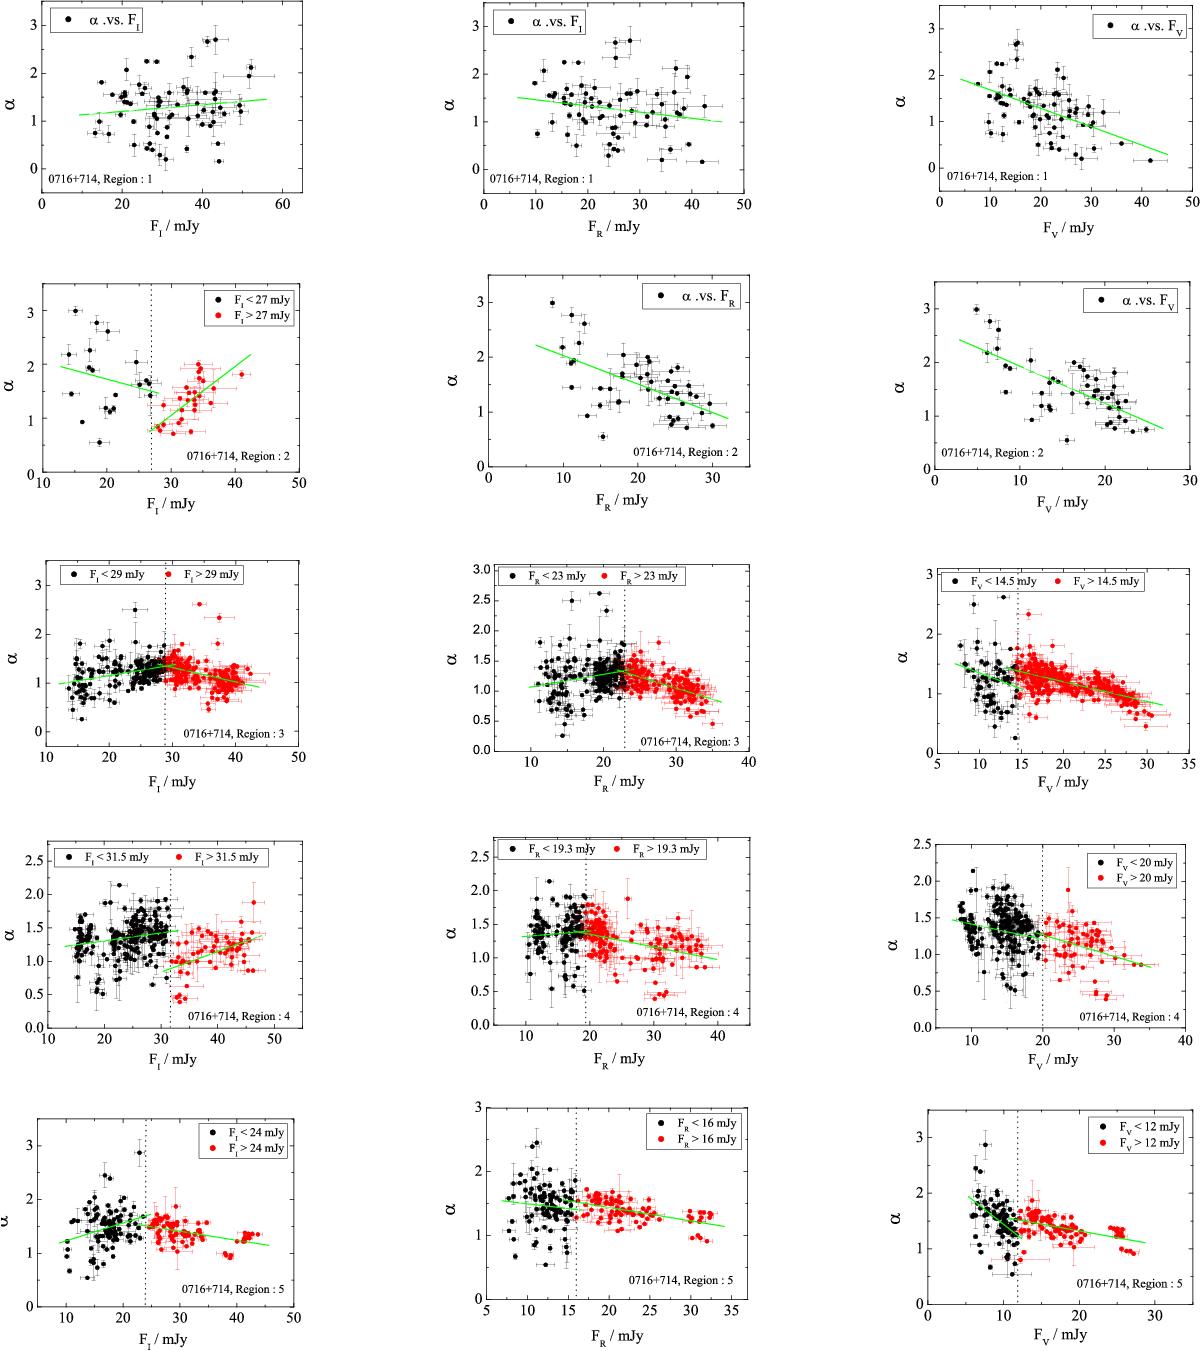
For S5 0716+714, the relations between α and FVRI at the five denser regions. The black dots and the red dots represent the different parts of the same regions. The green lines stand for the linear fitting between α and FVRI.
Current usage metrics show cumulative count of Article Views (full-text article views including HTML views, PDF and ePub downloads, according to the available data) and Abstracts Views on Vision4Press platform.
Data correspond to usage on the plateform after 2015. The current usage metrics is available 48-96 hours after online publication and is updated daily on week days.
Initial download of the metrics may take a while.