Fig. 2
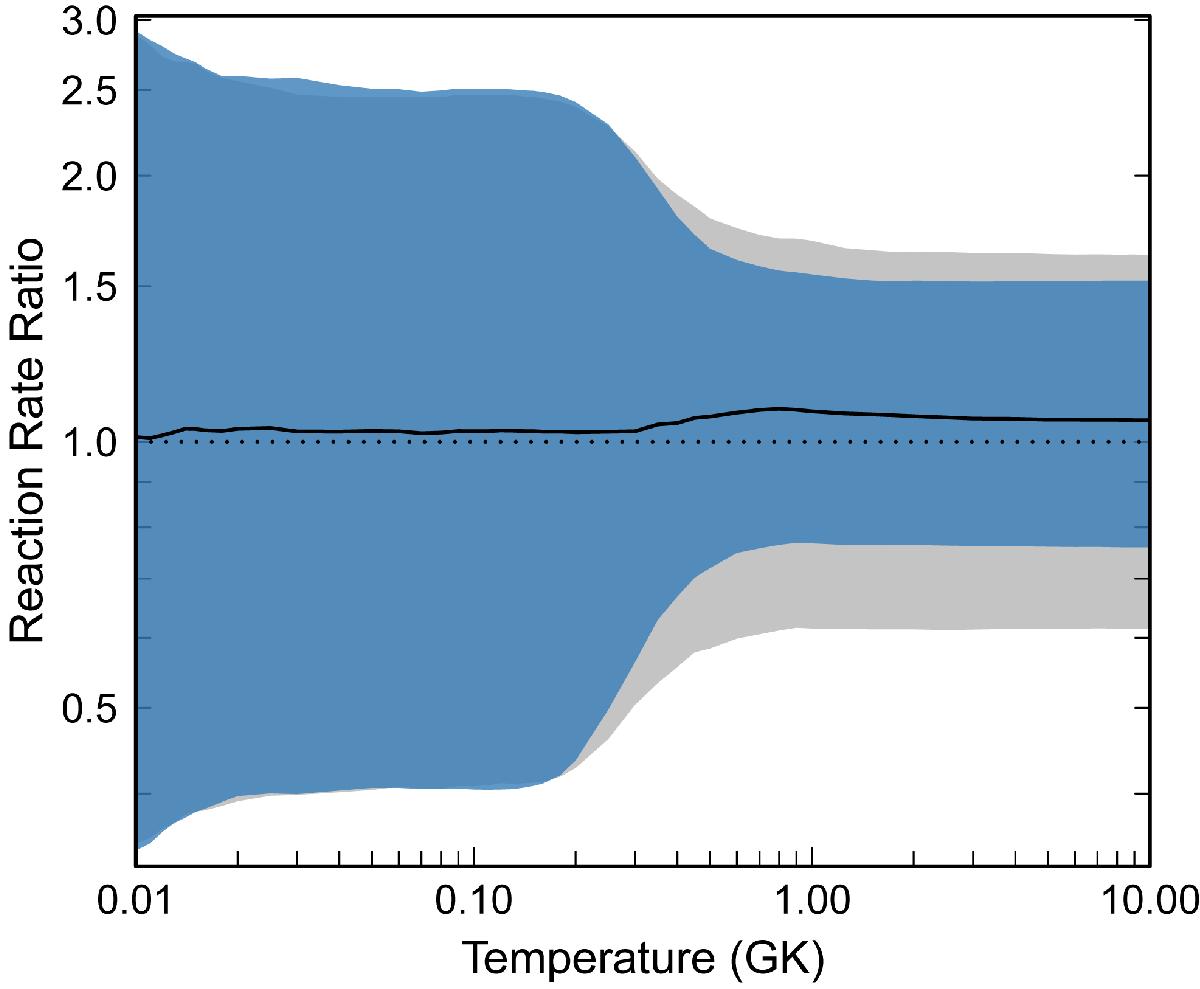
Reaction rate uncertainties as a function of temperature and normalized to the recommended rate. The blue shaded region shows the uncorrelated 1 − σ uncertainties of the rate, while the grey region represents rate uncertainties once correlated uncertainties are taken into account. Clearly, at low temperatures where the rate is dominated by only one resonance, there is no difference in the reaction rate uncertainties when applying this procedure.
Current usage metrics show cumulative count of Article Views (full-text article views including HTML views, PDF and ePub downloads, according to the available data) and Abstracts Views on Vision4Press platform.
Data correspond to usage on the plateform after 2015. The current usage metrics is available 48-96 hours after online publication and is updated daily on week days.
Initial download of the metrics may take a while.