Fig. 1
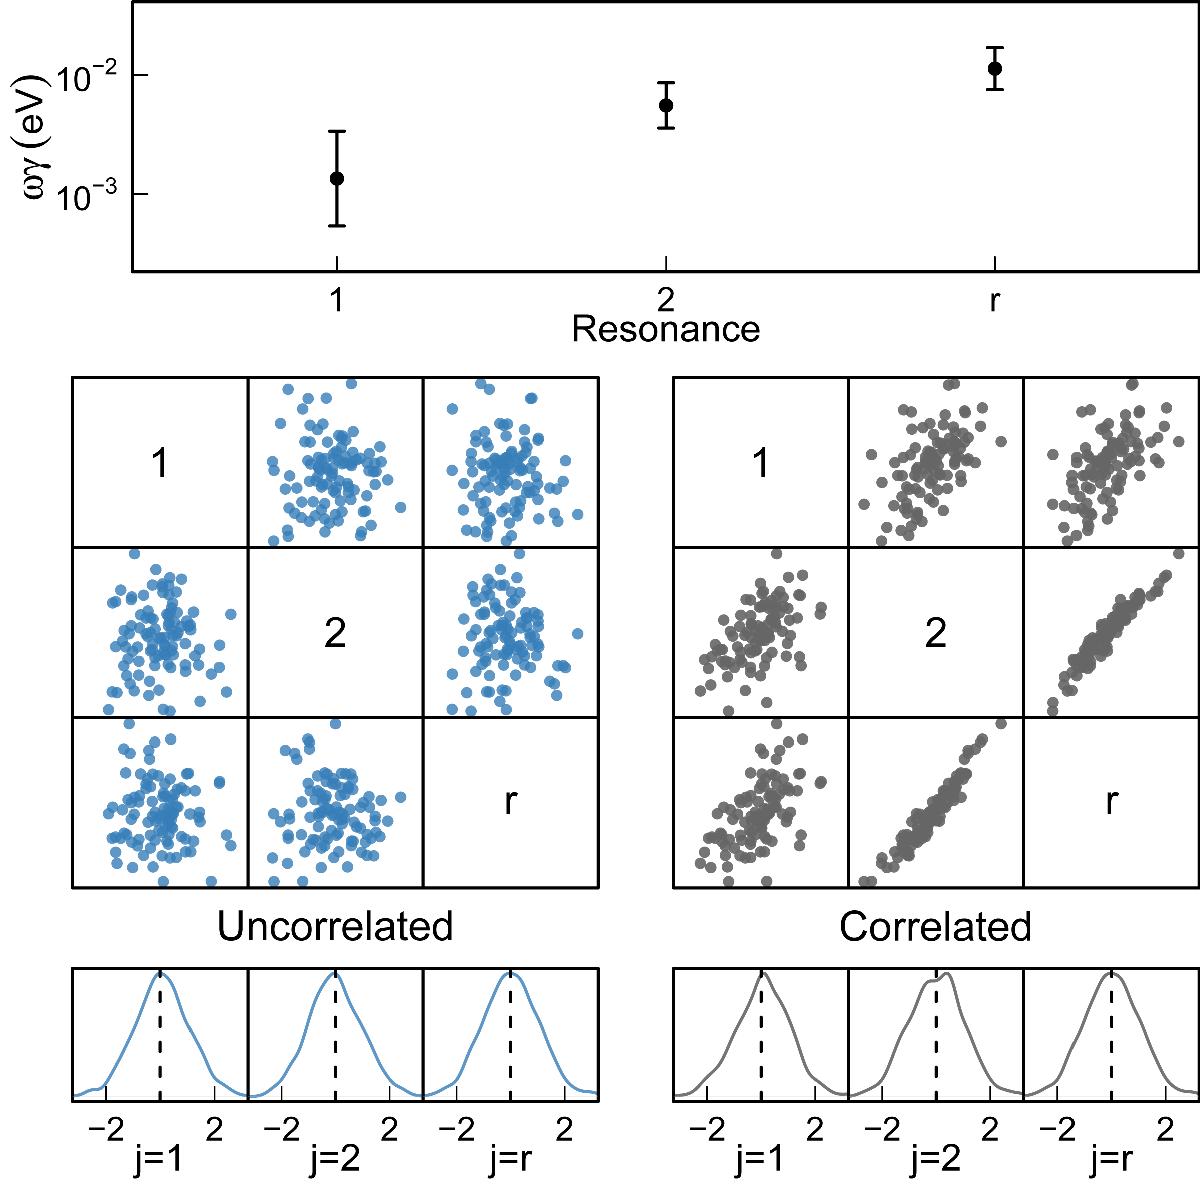
Example of correlated Monte Carlo samples. Top panel: strengths of our three example resonances including their uncertainties. Middle panel: uncorrelated (blue – yj) and correlated (grey – ![]() ) normally distributed samples, which are used to compute the resonance strengths in Eq. (17). Note that after applying the correlation outlined in the text, resonances 2 and r become highly correlated whereas resonance one remains largely unchanged. Lower two panels: density distributions of the samples, and confirms that the individual distributions do not vary outside of statistical fluctuations.
) normally distributed samples, which are used to compute the resonance strengths in Eq. (17). Note that after applying the correlation outlined in the text, resonances 2 and r become highly correlated whereas resonance one remains largely unchanged. Lower two panels: density distributions of the samples, and confirms that the individual distributions do not vary outside of statistical fluctuations.
Current usage metrics show cumulative count of Article Views (full-text article views including HTML views, PDF and ePub downloads, according to the available data) and Abstracts Views on Vision4Press platform.
Data correspond to usage on the plateform after 2015. The current usage metrics is available 48-96 hours after online publication and is updated daily on week days.
Initial download of the metrics may take a while.