Fig. 9
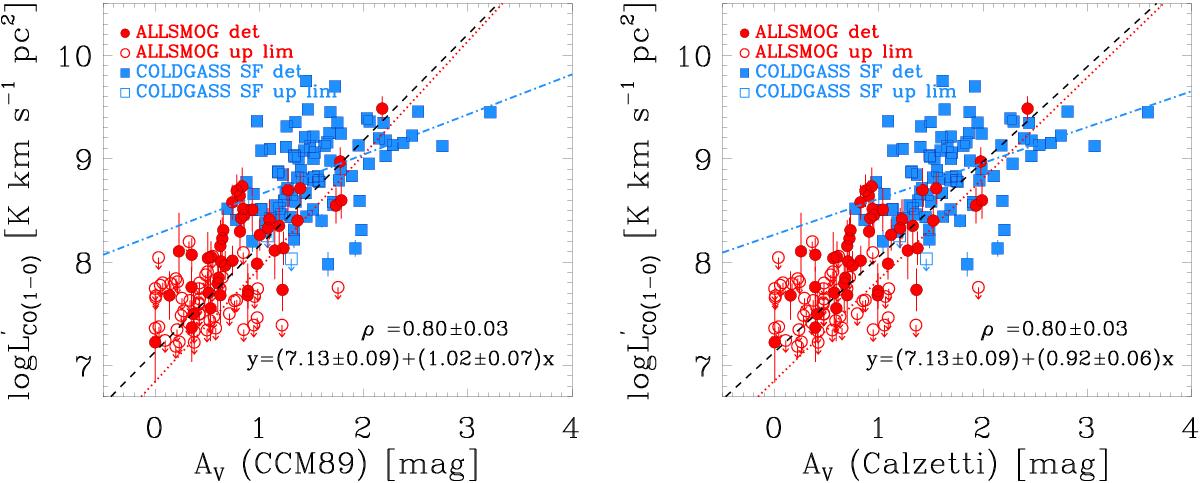
CO(1–0) line luminosity as a function of the nebular visual extinction for the sample of local star-forming galaxies defined by the ALLSMOG survey and by the sub-sample of COLD GASS selected in Sect. 5. The left and right panels shows the AV values obtained by using the attenuation curves proposed by Cardelli et al. (1989) and Calzetti et al. (2000), respectively. Further explanation relevant to the quantity plotted on the y-axis, the symbols and the regression analysis can be found in the caption of Fig. 8 and in the text (Sect. 7). Since the typical uncertainty on AV is very large, of the order of ~ 0.5 mag, the fit was performed without accounting for the measurement error on x, in order to not bias the results (see discussion in Kelly 2007). For the same reason the plots do not show error-bars in the x direction.
Current usage metrics show cumulative count of Article Views (full-text article views including HTML views, PDF and ePub downloads, according to the available data) and Abstracts Views on Vision4Press platform.
Data correspond to usage on the plateform after 2015. The current usage metrics is available 48-96 hours after online publication and is updated daily on week days.
Initial download of the metrics may take a while.