Fig. 6
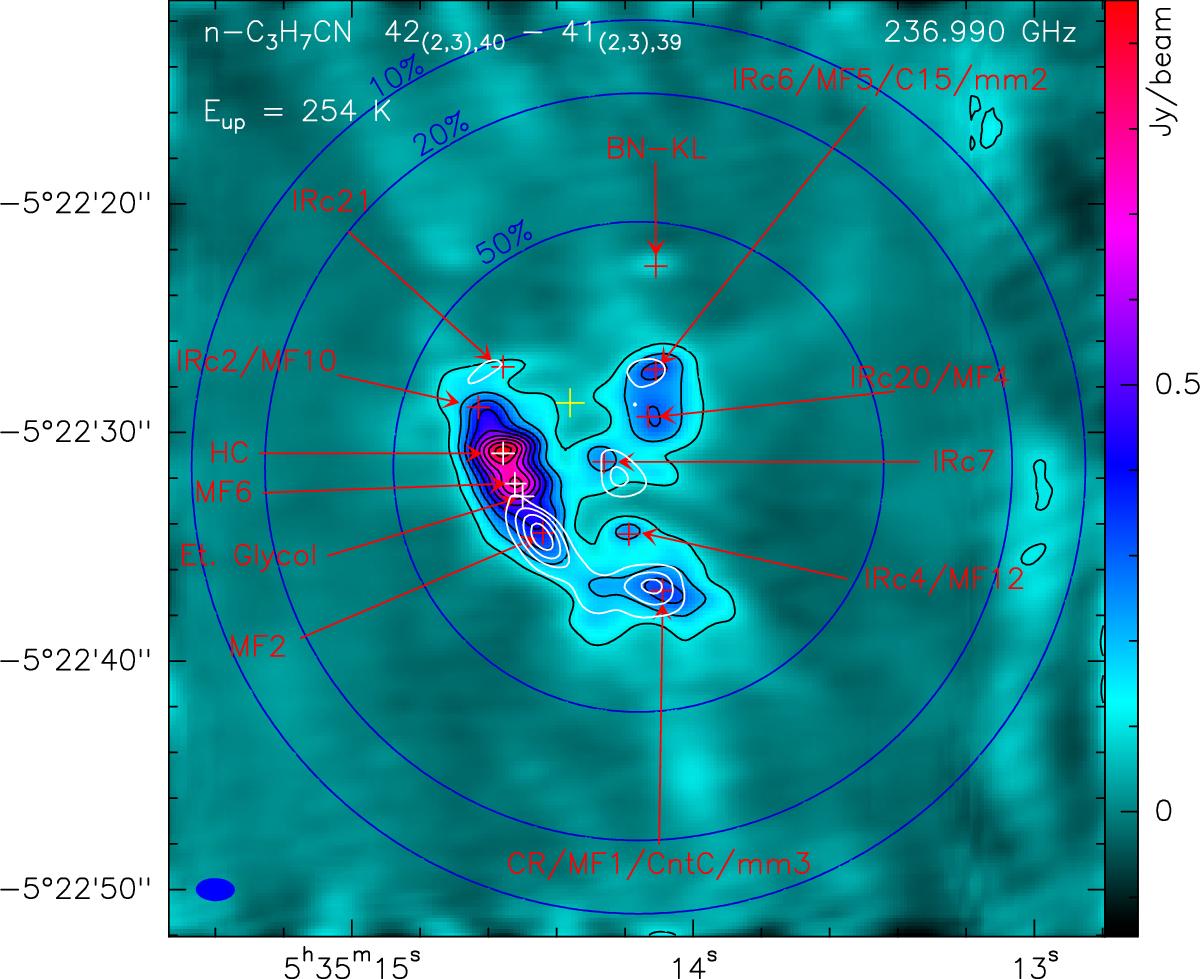
Integrated intensity map of the 236.990 GHz set of the n-C3H7CN isomer transitions (white contours) superimposed on the continuum map. The emission toward IRc7 and IRc21 and part of the emission toward MF2 are due to this species. Emission in other regions, especially the relatively strong emission seen toward CR/MF1 is due to emission from other molecular species at different velocities and appearing at the same frequency.
Current usage metrics show cumulative count of Article Views (full-text article views including HTML views, PDF and ePub downloads, according to the available data) and Abstracts Views on Vision4Press platform.
Data correspond to usage on the plateform after 2015. The current usage metrics is available 48-96 hours after online publication and is updated daily on week days.
Initial download of the metrics may take a while.