Fig. 4
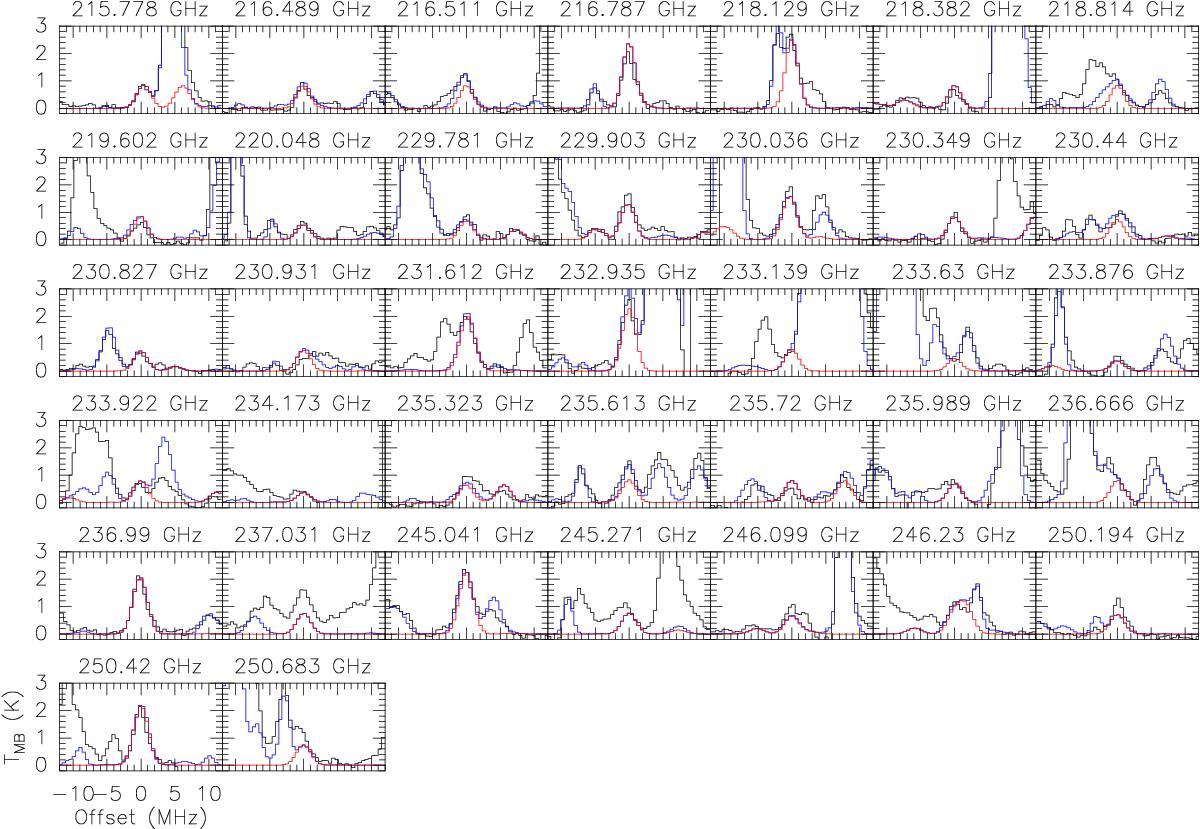
Detection of n-C3H7CN propyl cyanide isomer towards IRc21 (see map Fig. 1). In this and the following figures, the most intense lines are displayed (i.e. lines typically stronger than ~5σ. Weaker lines are hardly or not at all detectable and have no impact on the results, nor do lines blended with much stronger lines of other species). The data are in black and the fit is in red. The summation of the fit of all the species we have identified is displayed in blue.
Current usage metrics show cumulative count of Article Views (full-text article views including HTML views, PDF and ePub downloads, according to the available data) and Abstracts Views on Vision4Press platform.
Data correspond to usage on the plateform after 2015. The current usage metrics is available 48-96 hours after online publication and is updated daily on week days.
Initial download of the metrics may take a while.