Fig. 31
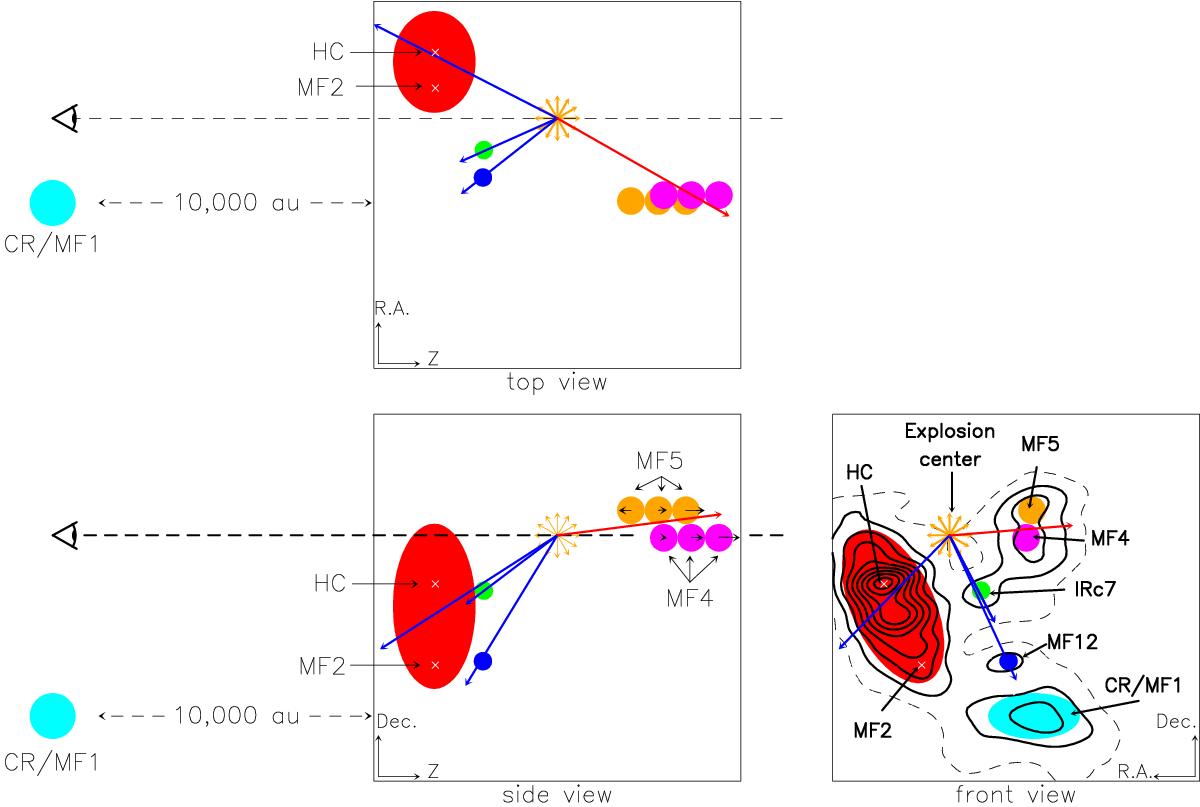
Different components in the KL region following the discussion in Sects. 4.4 and 4.5. The front view shows the continuum contours from Fig. 1 employing simple elliptical shapes to indicate the different parts of the cloud. The red ellipse includes the HC ridge, encompassing IRc21, MF10, MF6, MF2, and the glycol peak. The explosion center is indicated by the set of orange arrows, and the velocity shifts of both the bulk of the gas and the line wings are shown in the corresponding color. The respective position of MF12 (dark blue), IRc7 (green) and the HC group along the Z-axis is not known and the arrangement shown is arbitrary. The only constraint is that MF4 (purple)/MF5 (orange) be behind the explosion center and the rest of the components be in front along the Z-axis. We have also not given any inclination or bent shape to the HC ridge along the Z-axis. The CR/MF1 (cyan) source is supposed to be at least 10 000 AU in front but could also be behind. MF4 and MF5 are split into three blobs with small velocity arrows of increasing length (and possibly approaching the observer for the first MF5 blob) to illustrate that the farther away from the explosion center, the higher is the source’s velocity (see Table 3).
Current usage metrics show cumulative count of Article Views (full-text article views including HTML views, PDF and ePub downloads, according to the available data) and Abstracts Views on Vision4Press platform.
Data correspond to usage on the plateform after 2015. The current usage metrics is available 48-96 hours after online publication and is updated daily on week days.
Initial download of the metrics may take a while.