Free Access
Fig. 28
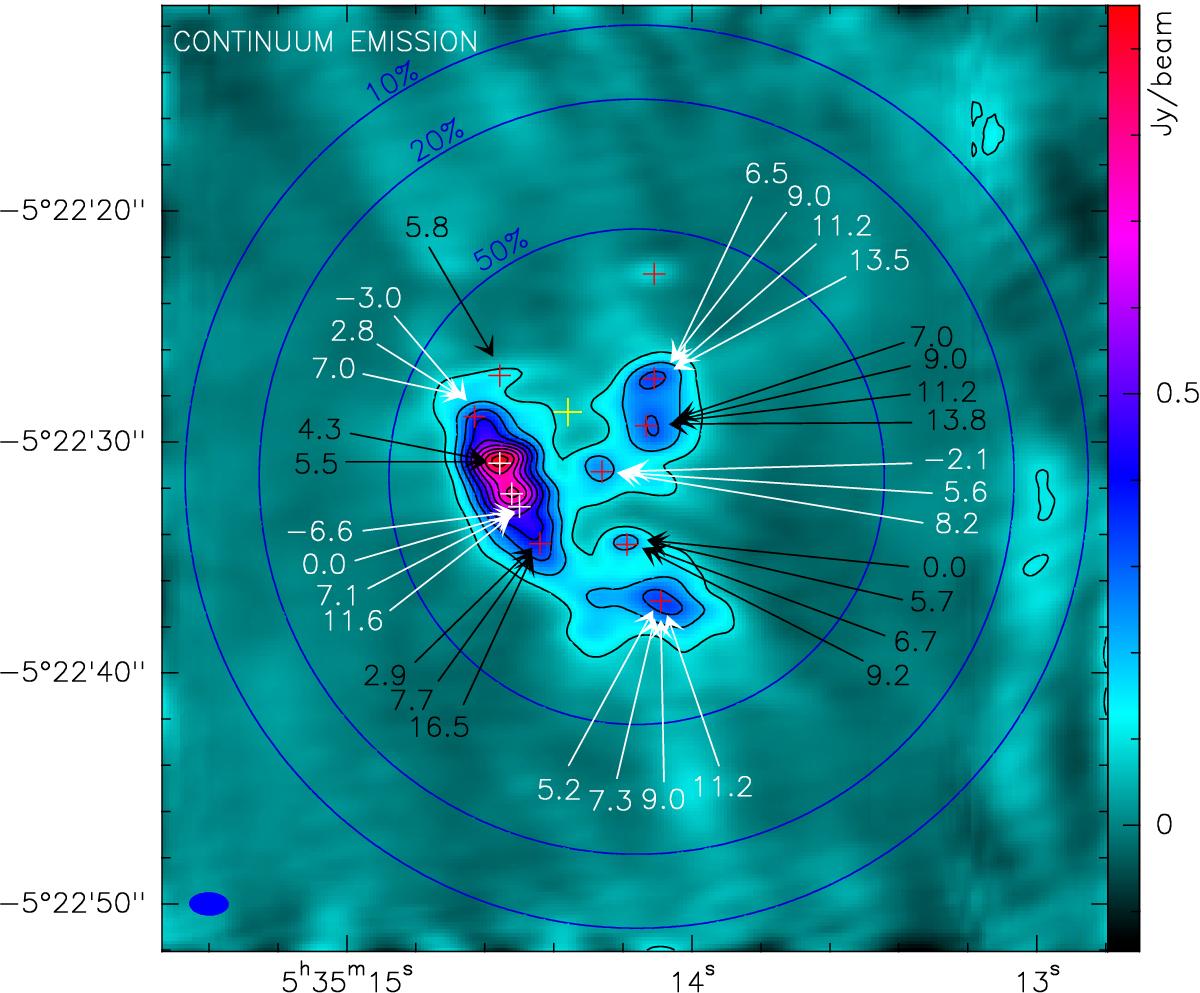
Velocities of the main components towards the ten sources in our study superimposed on a copy of Fig. 1. The alternating white and black arrows and figures have no meaning and are only used to separate more clearly the list of velocities at each spot.
Current usage metrics show cumulative count of Article Views (full-text article views including HTML views, PDF and ePub downloads, according to the available data) and Abstracts Views on Vision4Press platform.
Data correspond to usage on the plateform after 2015. The current usage metrics is available 48-96 hours after online publication and is updated daily on week days.
Initial download of the metrics may take a while.