Free Access
Fig. 27
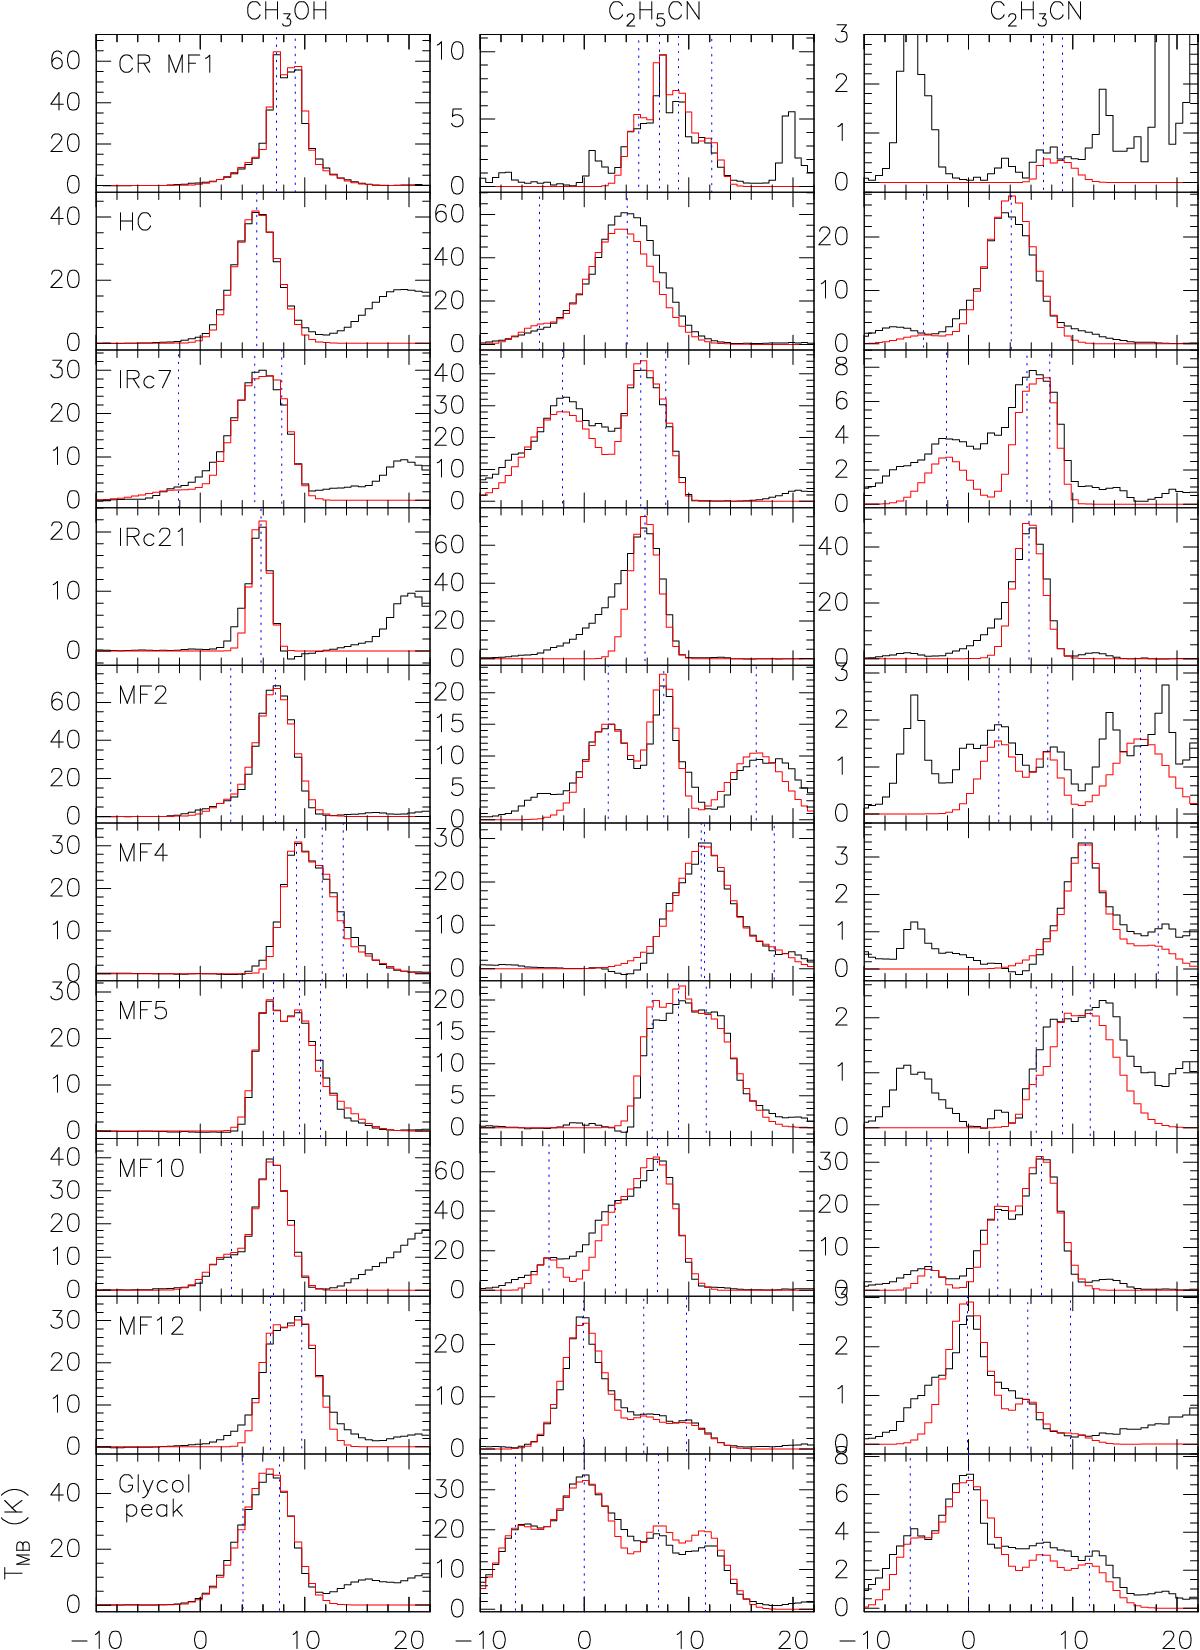
Methanol (CH3OH), vinyl cyanide (C2H3CN), and ethyl cyanide (C2H5CN) line profiles for the ten sources (see Fig. 1). The black line traces the data and the red line the LTE fit. The vertical dashed lines represent the velocity components introduced in the fit to match the observations.
Current usage metrics show cumulative count of Article Views (full-text article views including HTML views, PDF and ePub downloads, according to the available data) and Abstracts Views on Vision4Press platform.
Data correspond to usage on the plateform after 2015. The current usage metrics is available 48-96 hours after online publication and is updated daily on week days.
Initial download of the metrics may take a while.