Free Access
Fig. 24
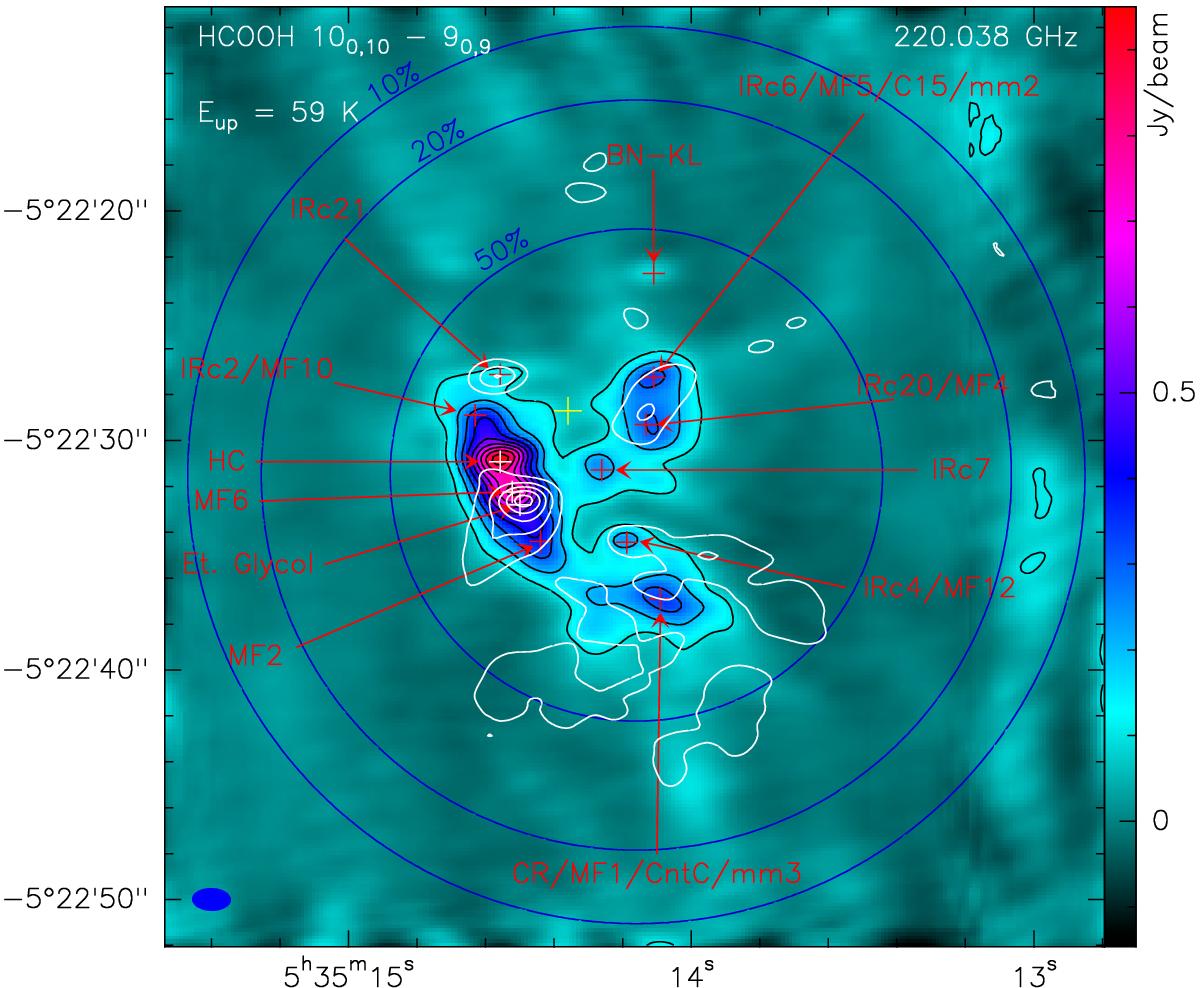
Integrated intensity map of formic acid (HCOOH) emission at 220.038 GHz (white contours) superimposed on the continuum emission map. The main emission peaks are centered on IRc21 (compact emission) and on the EGP (Et. glycol) with an extension outside of the region.
Current usage metrics show cumulative count of Article Views (full-text article views including HTML views, PDF and ePub downloads, according to the available data) and Abstracts Views on Vision4Press platform.
Data correspond to usage on the plateform after 2015. The current usage metrics is available 48-96 hours after online publication and is updated daily on week days.
Initial download of the metrics may take a while.