Fig. 1
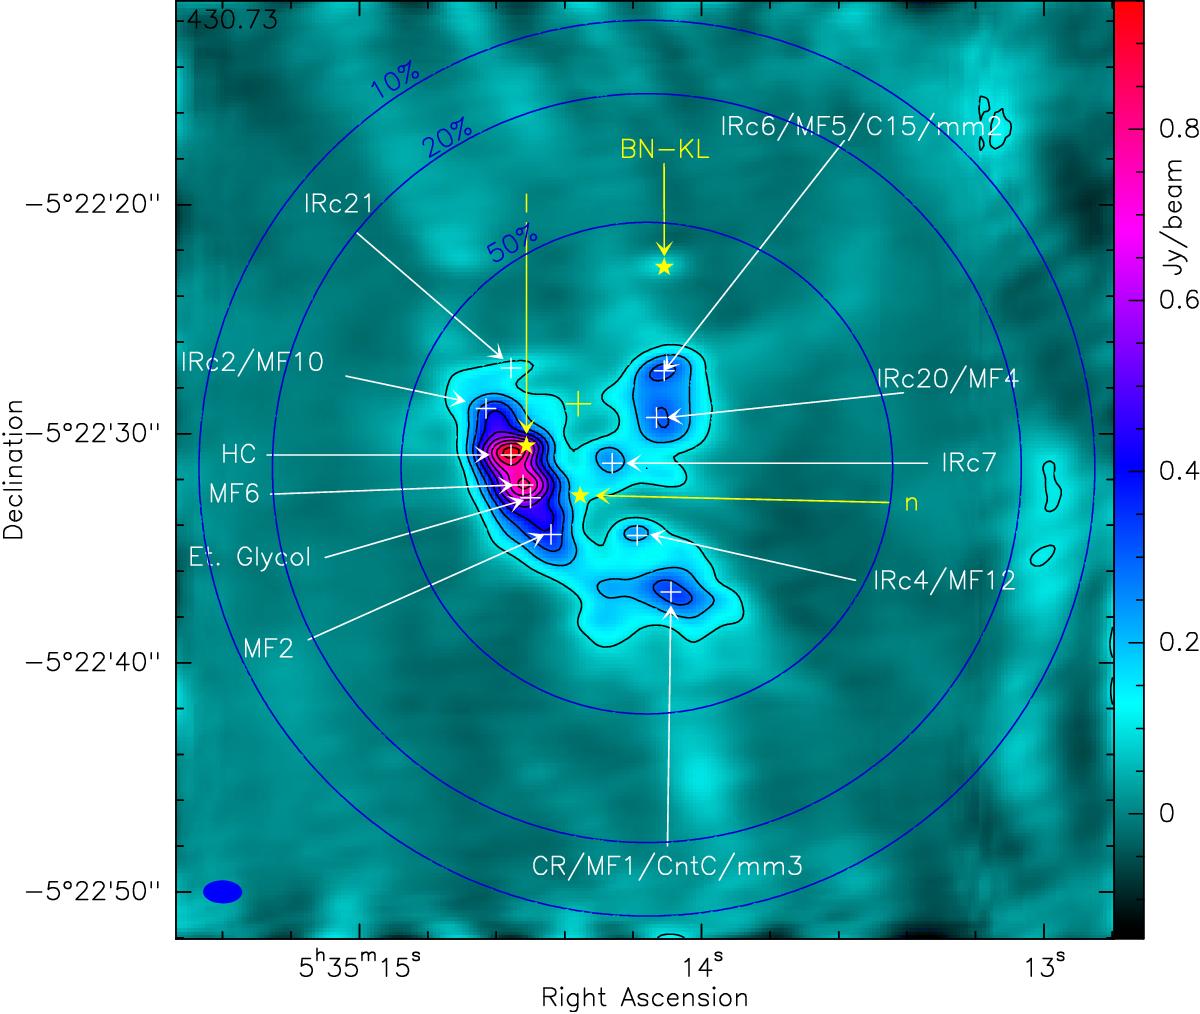
Continuum flux image of Orion-KL at ~1.3 mm, from an assemblage of channels free of line emission. The contours are every 100 mJy/beam (uncorrected for primary beam coupling). The ten sources analyzed in detail in this work are indicated and labeled (other labels of the same sources can be found in SIMBAD/CDS): HC = hot core, CR = compact ridge, MFxx from Favre et al. (2011a), Cxx from Friedel & Weaver (2011), IRcxx from Rieke et al. (1973), Shuping et al. (2004), mmxx from Feng et al. (2015) and references therein. The yellow cross indicates the center of explosion from which the BN, I, and n sources (marked by yellow stars) are moving away (Gómez et al. 2005). The blue circles mark the primary beam coupling efficiency (though the size changes by ±8% with frequency, decreasing with increasing frequency, we keep the same median case for all the figures). The primary beam coupling correction is not applied in the present and following figures.
Current usage metrics show cumulative count of Article Views (full-text article views including HTML views, PDF and ePub downloads, according to the available data) and Abstracts Views on Vision4Press platform.
Data correspond to usage on the plateform after 2015. The current usage metrics is available 48-96 hours after online publication and is updated daily on week days.
Initial download of the metrics may take a while.