Fig. 9
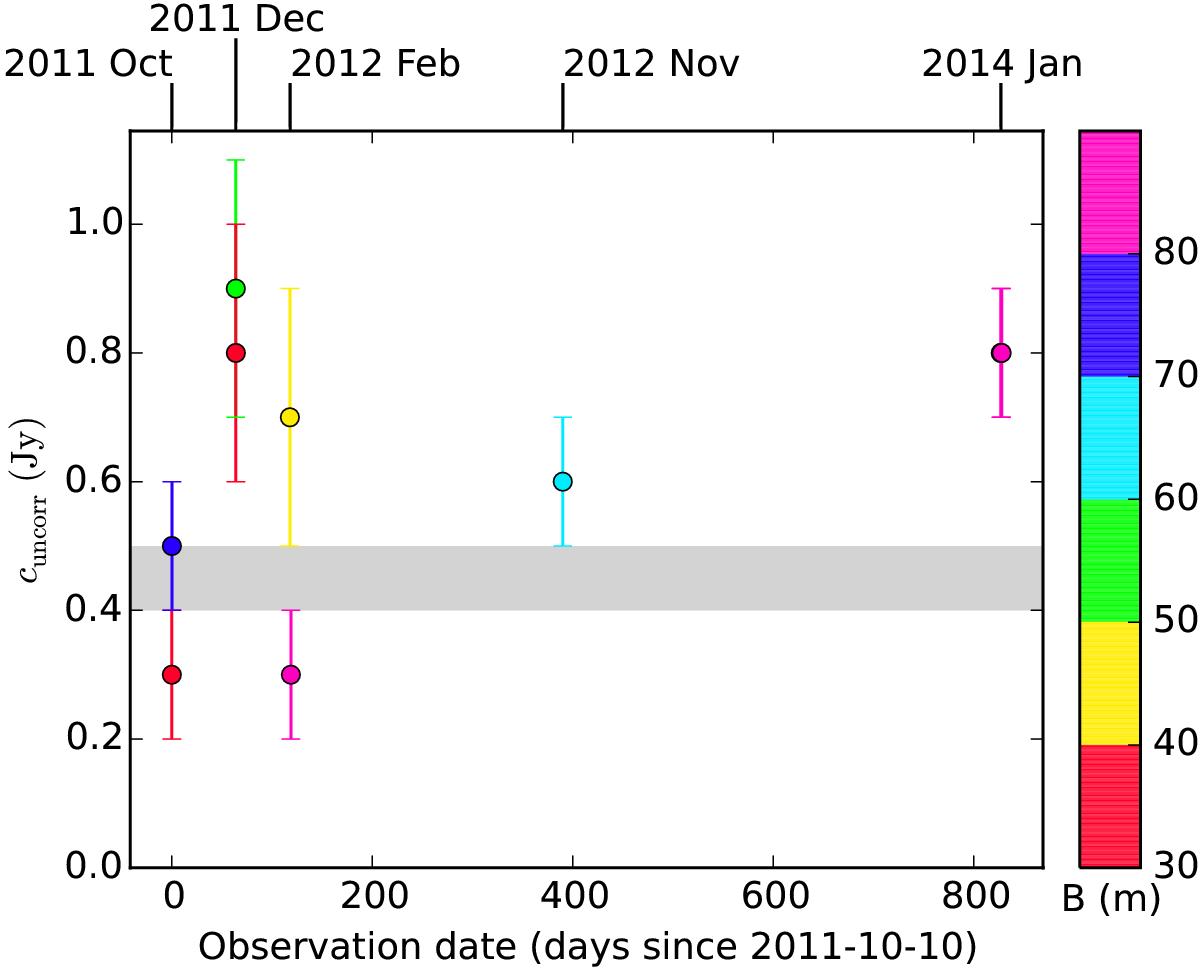
Amplitude of the silicate emission feature (cuncorr) plotted as a function of observation date. Symbols are color-coded for the projected baseline (B). Notice the large temporal variations of cuncorr. The gray stripe indicates the range of the emission feature strength obtained from radiative transfer modeling, see Sect. 4.4 for details.
Current usage metrics show cumulative count of Article Views (full-text article views including HTML views, PDF and ePub downloads, according to the available data) and Abstracts Views on Vision4Press platform.
Data correspond to usage on the plateform after 2015. The current usage metrics is available 48-96 hours after online publication and is updated daily on week days.
Initial download of the metrics may take a while.