Fig. 8
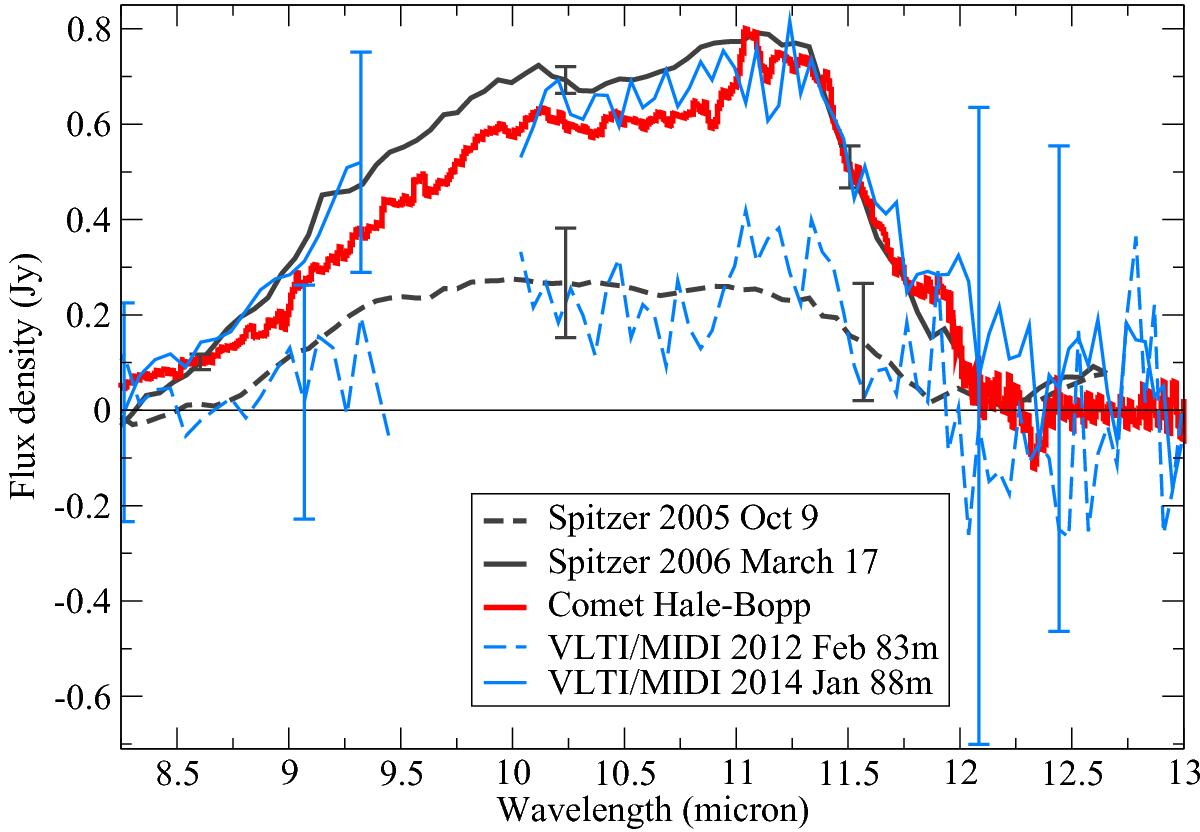
Emission feature in the spectra of DG Tau. Dashed and solid blue lines show the continuum subtracted uncorrelated spectra of DG Tau in two epochs. Dashed and solid gray lines show the continuum subtracted spectra measured by Spitzer in 2005 October 9 and 2006 March 17, respectively (Bary et al. 2009), corrected for an average absorption (see text for details). The red line represents the emission feature in the spectrum of comet Hale-Bopp, scaled to match the solid blue curve.
Current usage metrics show cumulative count of Article Views (full-text article views including HTML views, PDF and ePub downloads, according to the available data) and Abstracts Views on Vision4Press platform.
Data correspond to usage on the plateform after 2015. The current usage metrics is available 48-96 hours after online publication and is updated daily on week days.
Initial download of the metrics may take a while.