Fig. 7
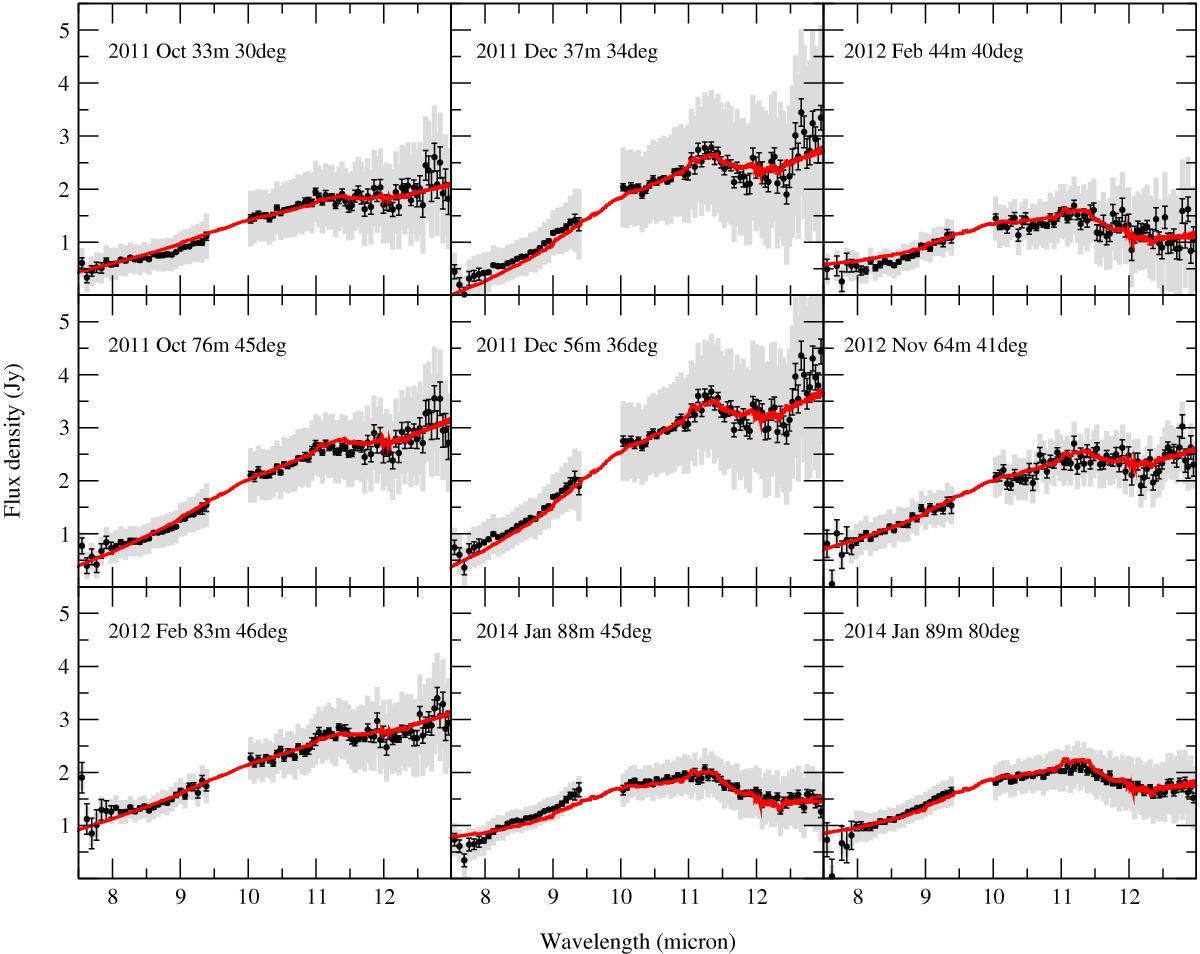
Uncorrelated spectra (black symbols) of DG Tau at different projected baselines and at different epochs. The part affected by the telluric ozone feature, between 9.4 μm and 10 μm is not shown. Red line represents the best-fit curve using the silicate spectrum of Hale-Bopp (Eq. (13)). The rows are categorized by approximate size of the observed baseline (top: short baseline, middle: intermediate baseline, bottom: long baseline). Gray shading indicates the level of total calibration uncertainties, while black error bars represent the random point-to-point uncertainties (see Appendix A for more details on error calculation).
Current usage metrics show cumulative count of Article Views (full-text article views including HTML views, PDF and ePub downloads, according to the available data) and Abstracts Views on Vision4Press platform.
Data correspond to usage on the plateform after 2015. The current usage metrics is available 48-96 hours after online publication and is updated daily on week days.
Initial download of the metrics may take a while.