Fig. 11
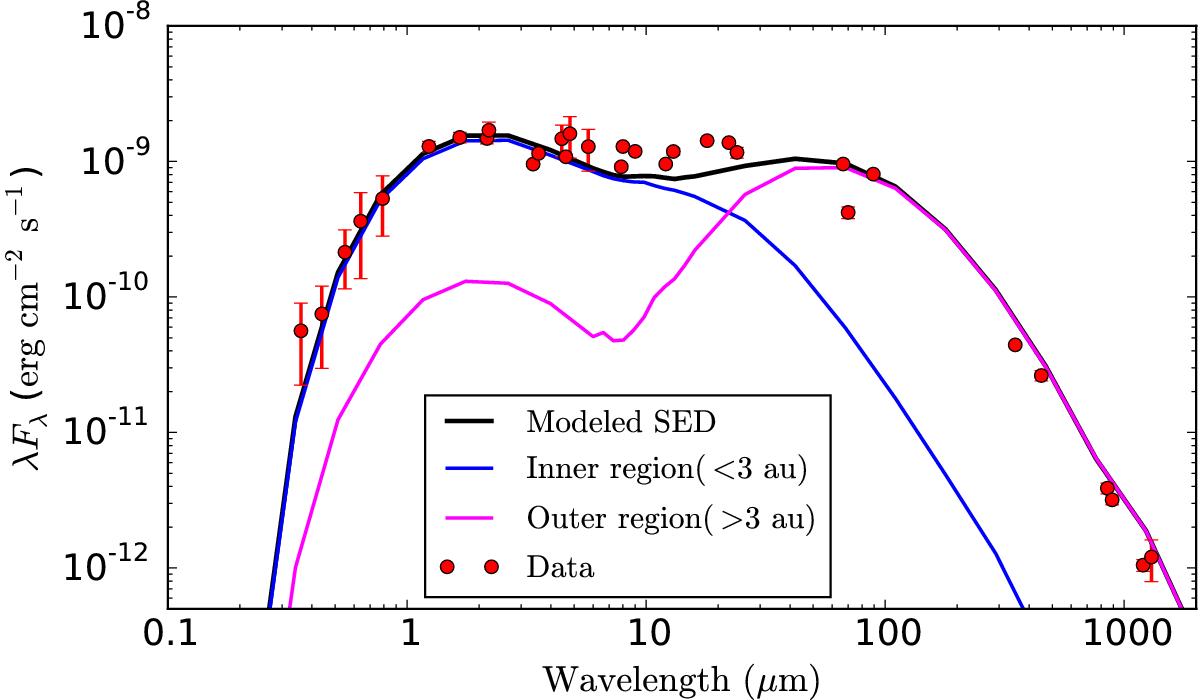
SED (black line) from the radiative transfer model, together with the observed SED of DG Tau (red circles). We also plot the flux contributions from different radial regions: the inner region including the star and the inner disk (<3 au, blue) and the outer disk (>3 au, purple). We note that in the optical regime time-averaged data points are shown and their error bars indicate temporal variability. The data points are from the literature (Egret et al. 1992; Kislyuk et al. 2000; Zacharias et al. 2004, 2012, 2015; Röser et al. 2008; Niels Bohr Institute et al. 2014; Morel & Magnenat 1978; Droege et al. 2006; Henden et al. 2016; Herbig & Bell 1988; Ahn et al. 2012; Skiff 2014; Kraus et al. 2011; Ayres 2010; Folha & Emerson 2001; Grankin et al. 2007; Assafin et al. 1996; Richichi & Percheron 2002; Richichi et al. 2005; Connelley & Greene 2010; Cutri et al. 2003, 2014; Bary et al. 2009; Kóspál et al. 2012; Luhman et al. 2006; Cieza et al. 2009; Salyk et al. 2013; Ishihara et al. 2010; Yamamura et al. 2010; Di Francesco et al. 2008; Andrews et al. 2013; Altenhoff et al. 1994; Dzib et al. 2015).
Current usage metrics show cumulative count of Article Views (full-text article views including HTML views, PDF and ePub downloads, according to the available data) and Abstracts Views on Vision4Press platform.
Data correspond to usage on the plateform after 2015. The current usage metrics is available 48-96 hours after online publication and is updated daily on week days.
Initial download of the metrics may take a while.