Fig. 9
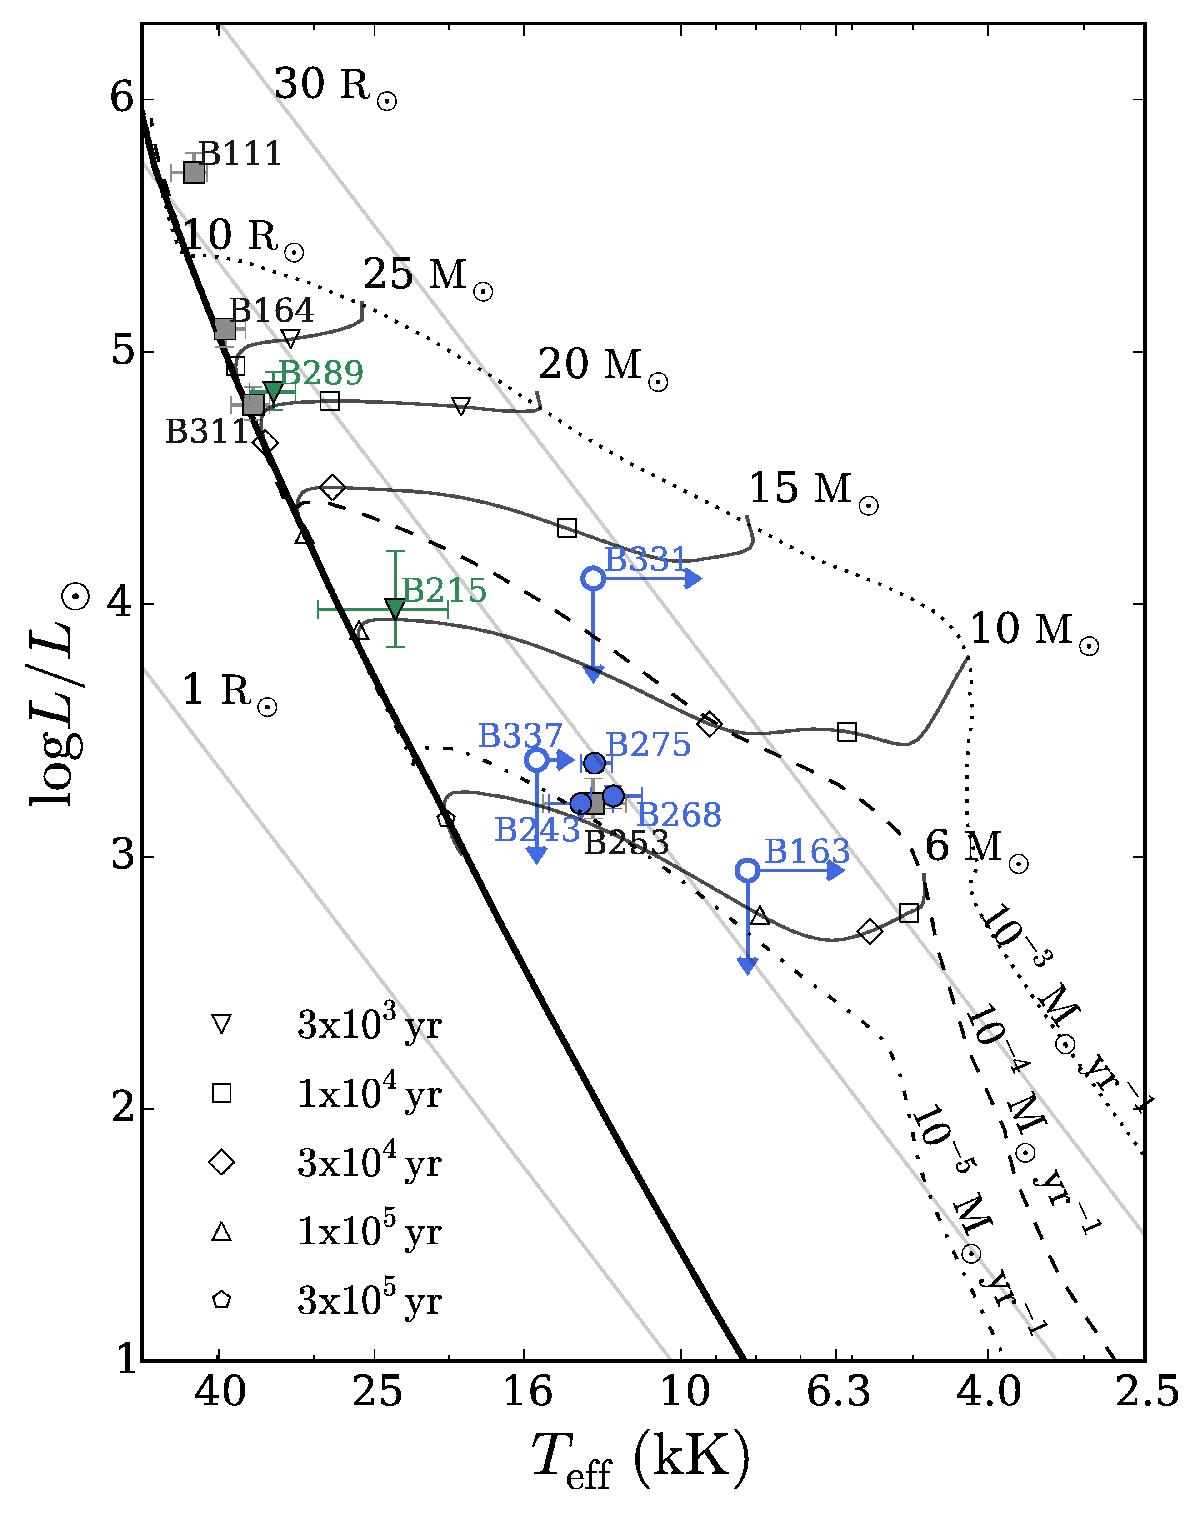
Hertzsprung-Russell diagram for the observed objects in M17. The blue dots show the location of the targets for which we found evidence of a gaseous disk; the green triangles denote the stars that show IR excess longward of 2.5 μm and no emission lines in their spectra. The grey squares show the objects without disk signatures. The stars for which the parameters are derived using FASTWIND are shown with filled symbols. The open symbols represent the stars for which log L/L⊙ and Teff were derived from their spectral type. The ZAMS is represented by the thick black line and the solid lines correspond to PMS tracks from Hosokawa & Omukai (2009) with the ZAMS mass labelled and the lifetimes indicated as open symbols. The dotted, dashed, and dashed-dotted lines are the birth lines for accretion rates of 10-3, 10-4, and 10-5M⊙ yr-1, respectively. The grey lines indicate radii of 1, 10, and 30 R⊙.
Current usage metrics show cumulative count of Article Views (full-text article views including HTML views, PDF and ePub downloads, according to the available data) and Abstracts Views on Vision4Press platform.
Data correspond to usage on the plateform after 2015. The current usage metrics is available 48-96 hours after online publication and is updated daily on week days.
Initial download of the metrics may take a while.