Fig. 8
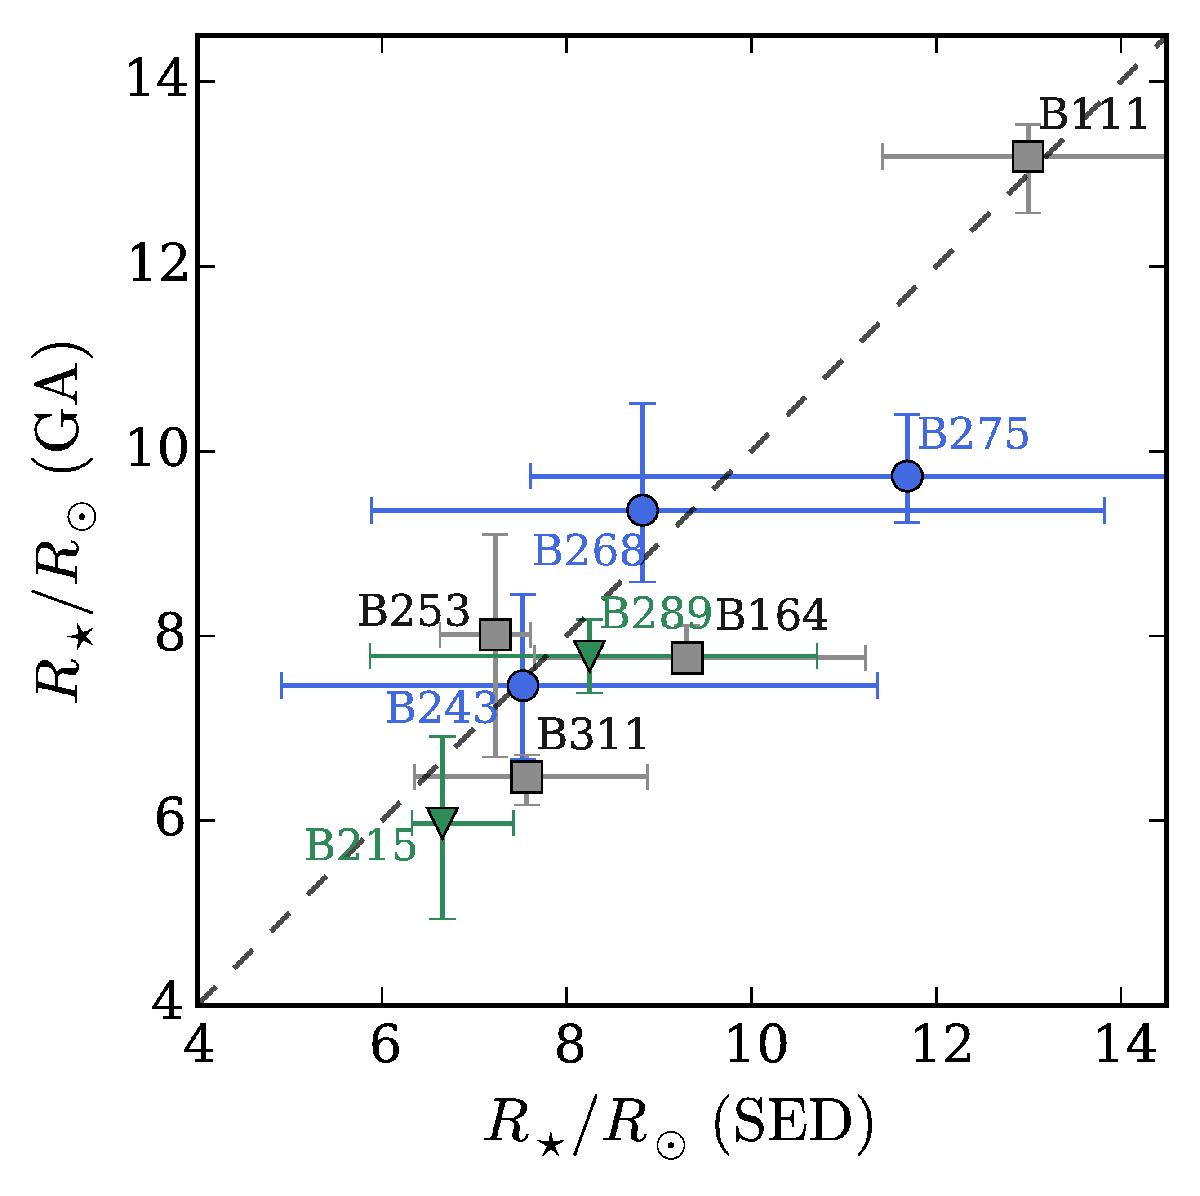
Comparison of the values for the stellar radius R⋆ obtained via SED fitting and GA analysis. The symbols and error bars correspond to the results obtained in Sects. 4 and 5; the dashed line represents the one-to-one correlation. The blue dots show the location of the targets for which we found evidence of a gaseous disk; the green triangles denote the stars that show IR excess longward of 2.5 μm and no emission lines in their spectra. The grey squares show the objects without disks. The values are consistent within the errors.
Current usage metrics show cumulative count of Article Views (full-text article views including HTML views, PDF and ePub downloads, according to the available data) and Abstracts Views on Vision4Press platform.
Data correspond to usage on the plateform after 2015. The current usage metrics is available 48-96 hours after online publication and is updated daily on week days.
Initial download of the metrics may take a while.