Fig. 16
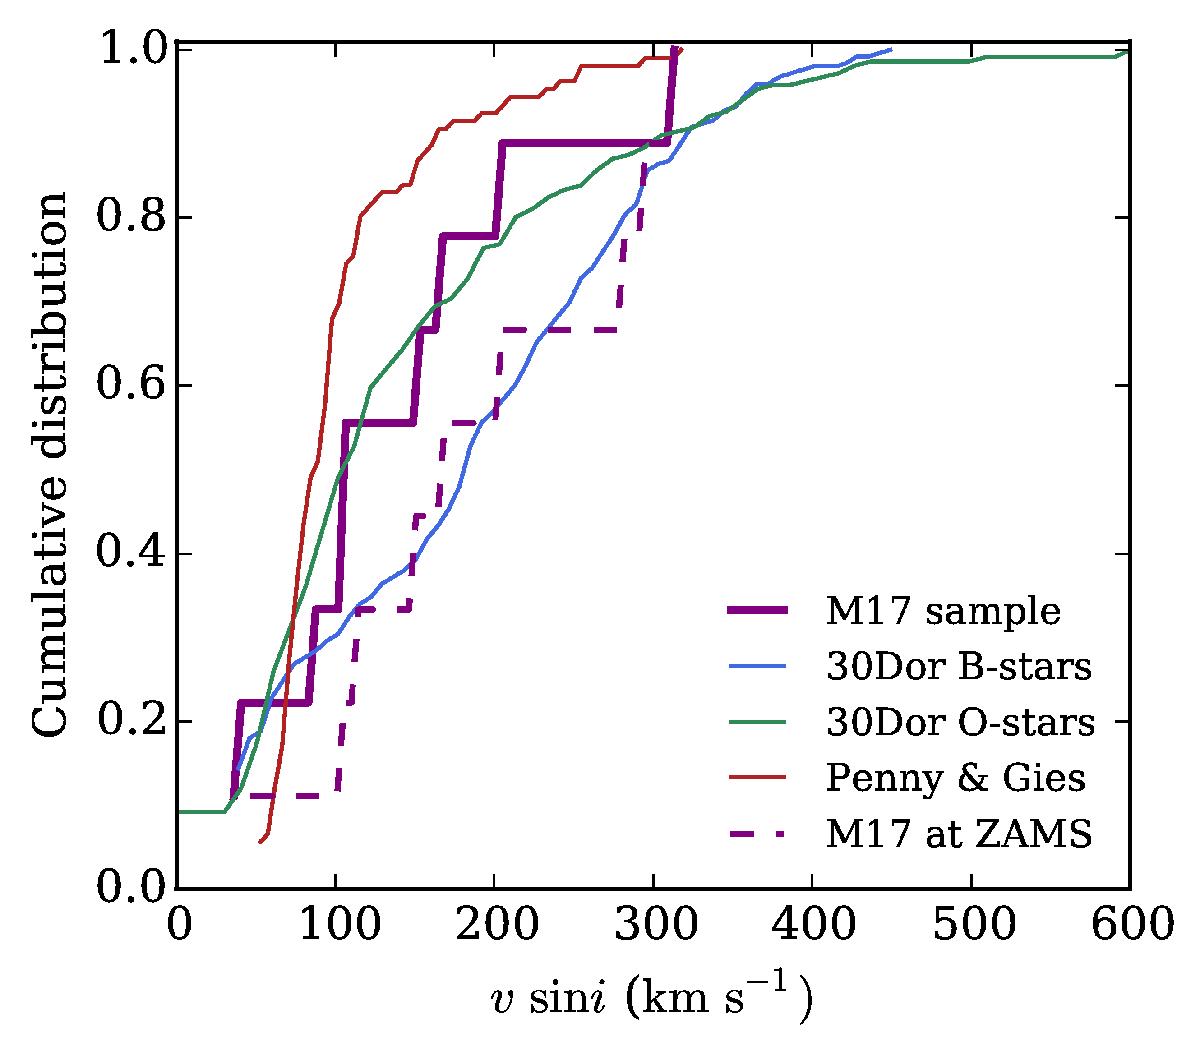
Comparison of the cumulative distribution of projected rotational velocities of our sample (purple, 9 stars); Dufton et al. (2013; blue, 251 stars); Ramírez-Agudelo et al. (2013; green, 216 stars); and Penny & Gies (2009; red, 106 stars). The dashed line indicates the distribution of projected rotational velocities of our stars upon arrival at the ZAMS assuming rigid rotation (analogous to homologous contraction) and angular momentum conservation.
Current usage metrics show cumulative count of Article Views (full-text article views including HTML views, PDF and ePub downloads, according to the available data) and Abstracts Views on Vision4Press platform.
Data correspond to usage on the plateform after 2015. The current usage metrics is available 48-96 hours after online publication and is updated daily on week days.
Initial download of the metrics may take a while.