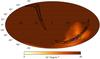
Fig. 5
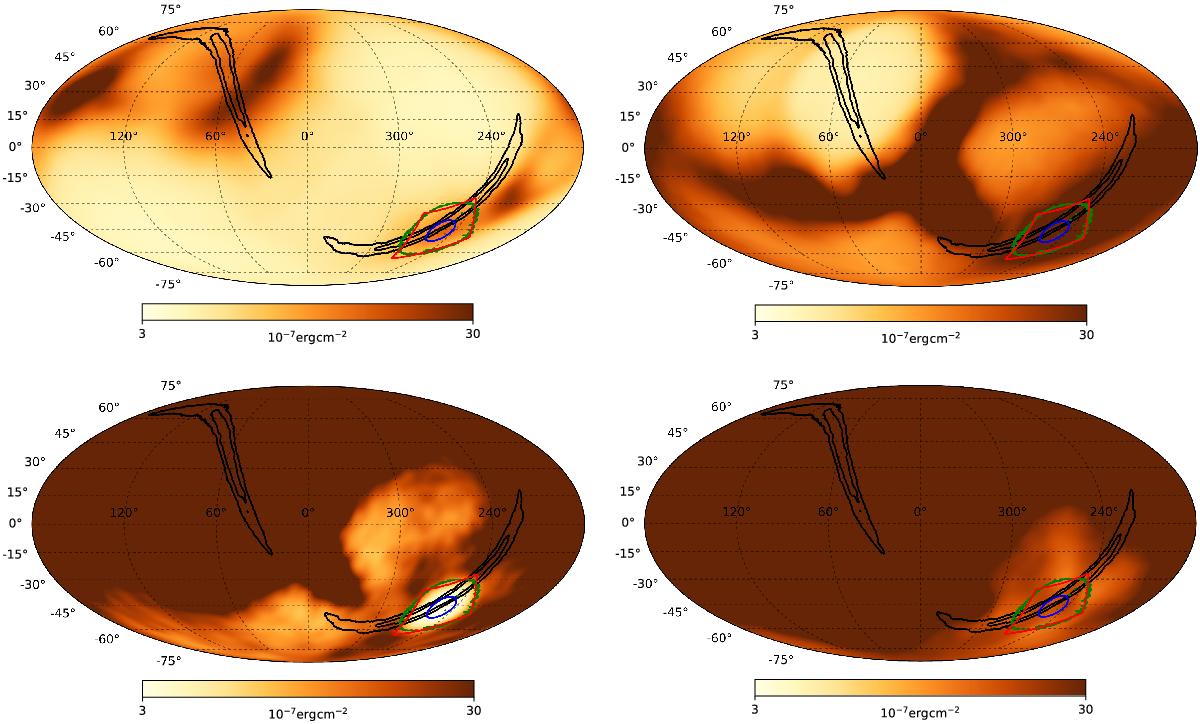
Sensitivity maps of SPI-ACS, IBIS/Veto, IBIS/PICsIT, and IBIS/ISGRI for the detection of an 8 s soft GRB event at 3σ confidence level whose spectral energy distribution is described by a Comptonized model with parameters α = −1 and Epeak = 300 keV). We represent with black contours the most accurate localization of the GW event (at 50% and 90% confidence levels) obtained by the LALInference (Abbott et al. 2016a). Red, green, and blue contours indicate the sky regions within which the respective sensitivity of ISGRI, SPI, and JEM-X is not degrading more than a factor of 20 compared to the on-axis value.
Current usage metrics show cumulative count of Article Views (full-text article views including HTML views, PDF and ePub downloads, according to the available data) and Abstracts Views on Vision4Press platform.
Data correspond to usage on the plateform after 2015. The current usage metrics is available 48-96 hours after online publication and is updated daily on week days.
Initial download of the metrics may take a while.