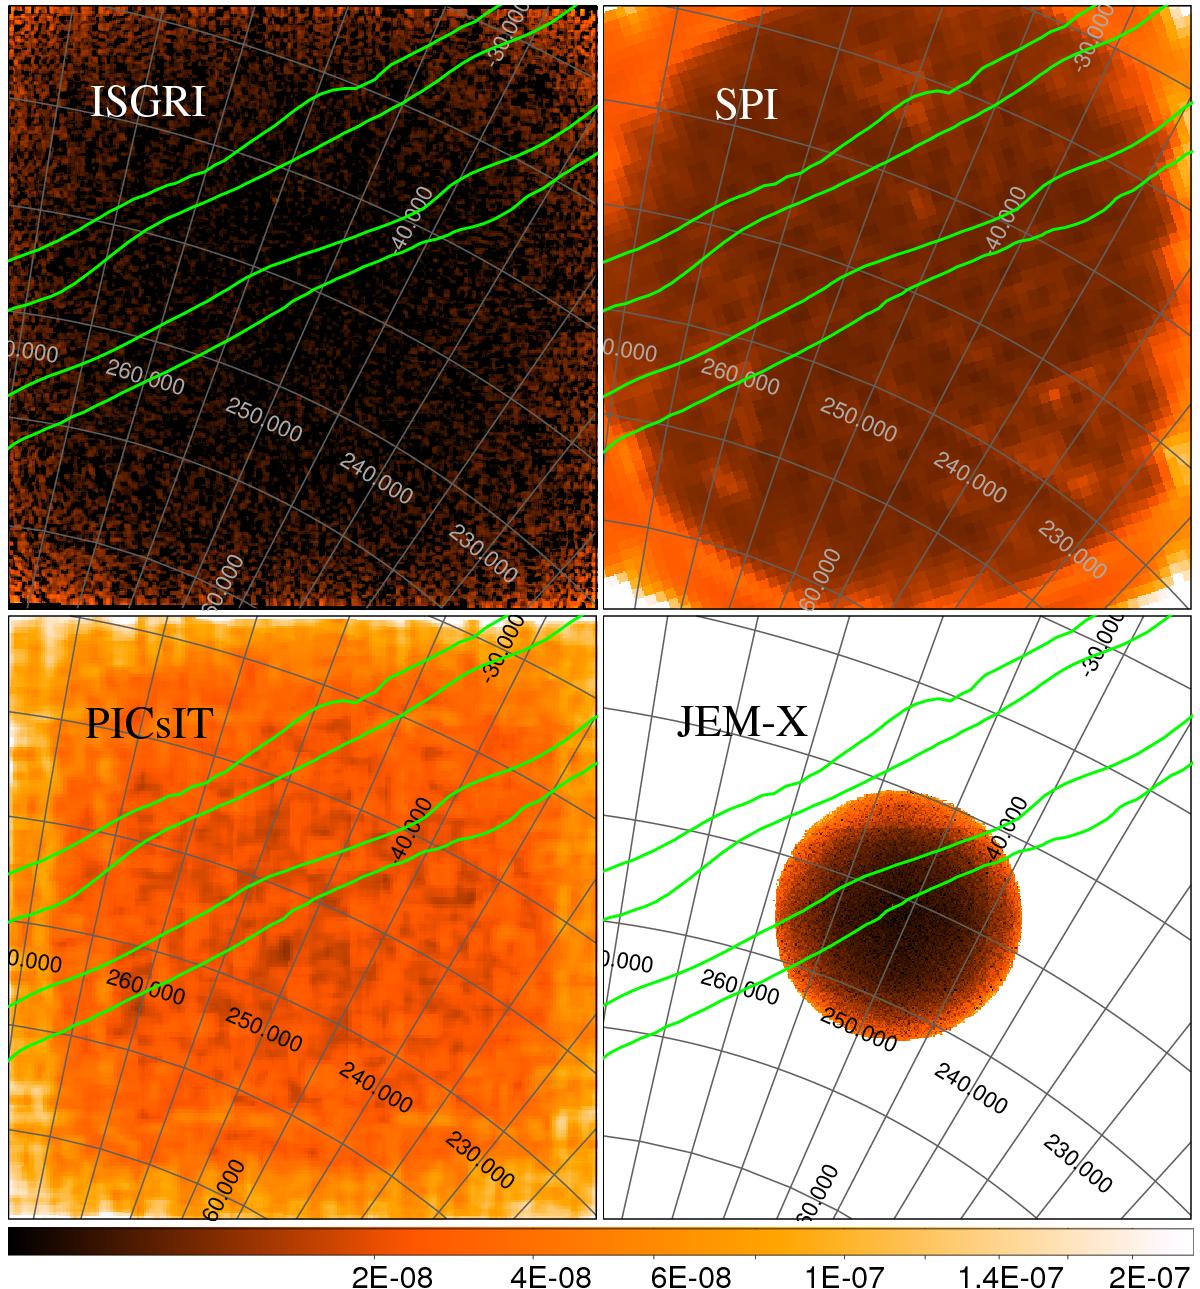
Fig. 4

Sensitivity maps within the INTEGRAL IBIS/ISGRI (20–200 keV), IBIS/PICsIT (260–2000 keV), SPI (25–8000 keV), and the combined JEM-X1 and JEM-X2 modules (3.–35. keV) FoVs during the time interval spanning from a minimum of T0−30 s to a maximum of T0 + 287 s (depending on instrument). The units reported below the color bar are erg cm-2 s-1. We also show in green the 90% and 50% confidence level contours of the LIGO LVT151012 localization region.
Current usage metrics show cumulative count of Article Views (full-text article views including HTML views, PDF and ePub downloads, according to the available data) and Abstracts Views on Vision4Press platform.
Data correspond to usage on the plateform after 2015. The current usage metrics is available 48-96 hours after online publication and is updated daily on week days.
Initial download of the metrics may take a while.


