Fig. 8
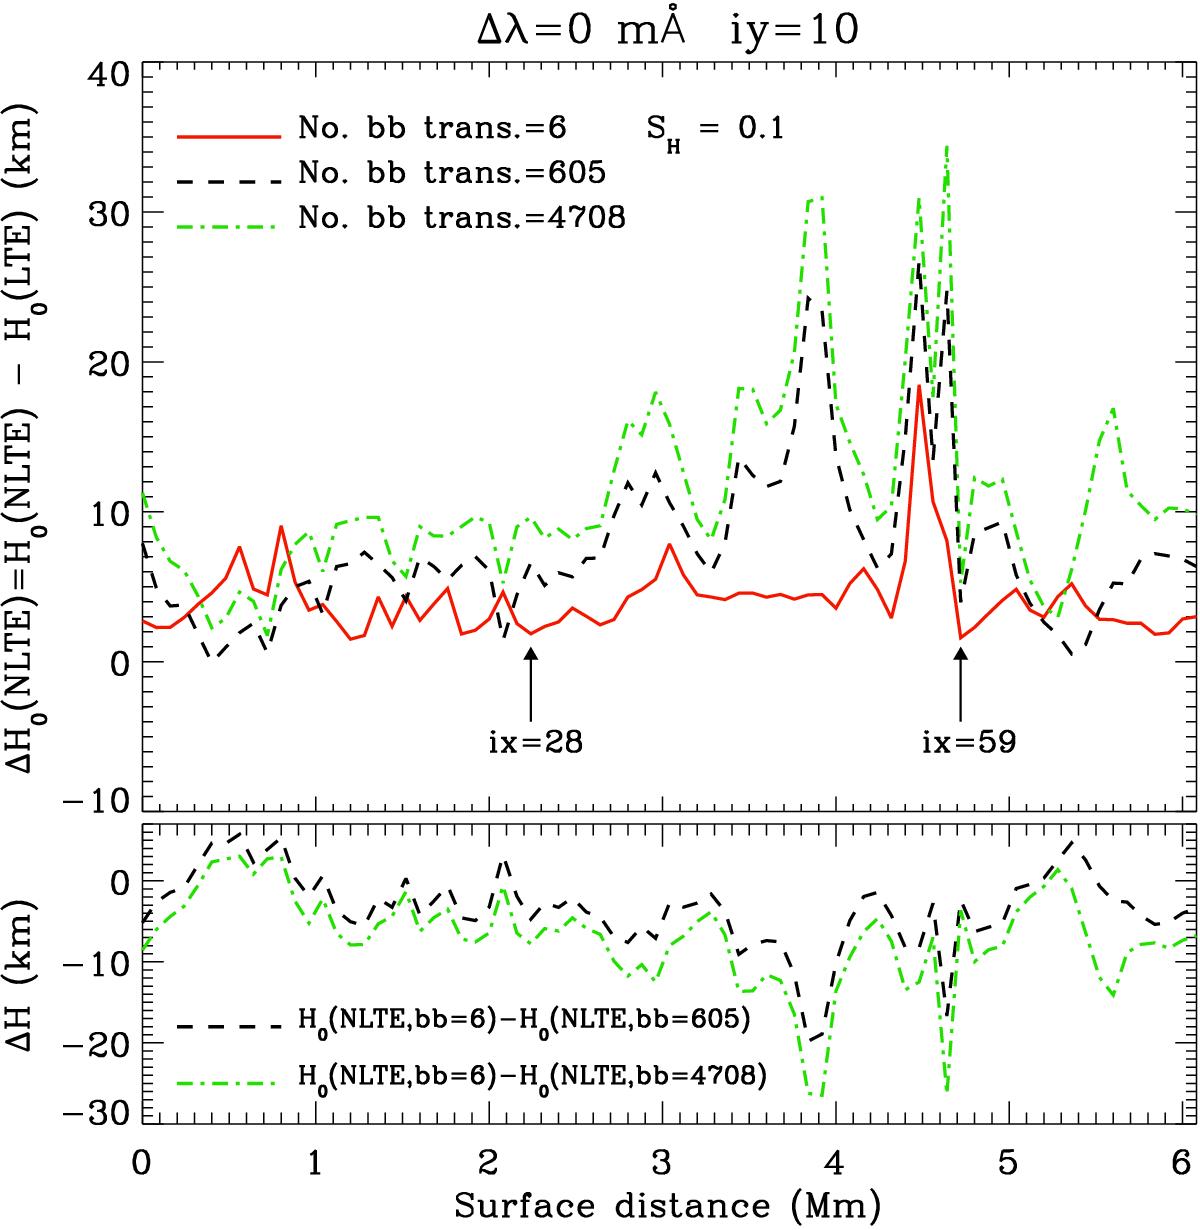
Top panel: the shift of the height of formation ΔH0(NLTE) = H0(NLTE)−H0(LTE) of the Si i 10 827 Å line center (Δλ = 0) along the surface line iy = 10 in the 3D snapshot with ⟨ | BZ | ⟩ = 80 G caused by the line opacity change due to the NLTE effects. Curves of different colours indicate results obtained using three different models of the silicon atom. Arrows mark the grid points ix = 28 (the granule) and ix = 59 (the intergranule). Bottom panel: the differences ΔH between the NLTE heights H0(NLTE) of formation of the line center along the same surface line iy = 10 produced by using three different silicon model atoms. Dashed curve: the ΔH values found by comparing the H0(NLTE) values for the simplest Si i model with six bb transitions and for the Si i working model with 605 bb transitions. Dash-dotted green curve: the ΔH values obtained by using the simplest Si i model and the comprehensive one with 4708 bb transitions.
Current usage metrics show cumulative count of Article Views (full-text article views including HTML views, PDF and ePub downloads, according to the available data) and Abstracts Views on Vision4Press platform.
Data correspond to usage on the plateform after 2015. The current usage metrics is available 48-96 hours after online publication and is updated daily on week days.
Initial download of the metrics may take a while.