Fig. 6
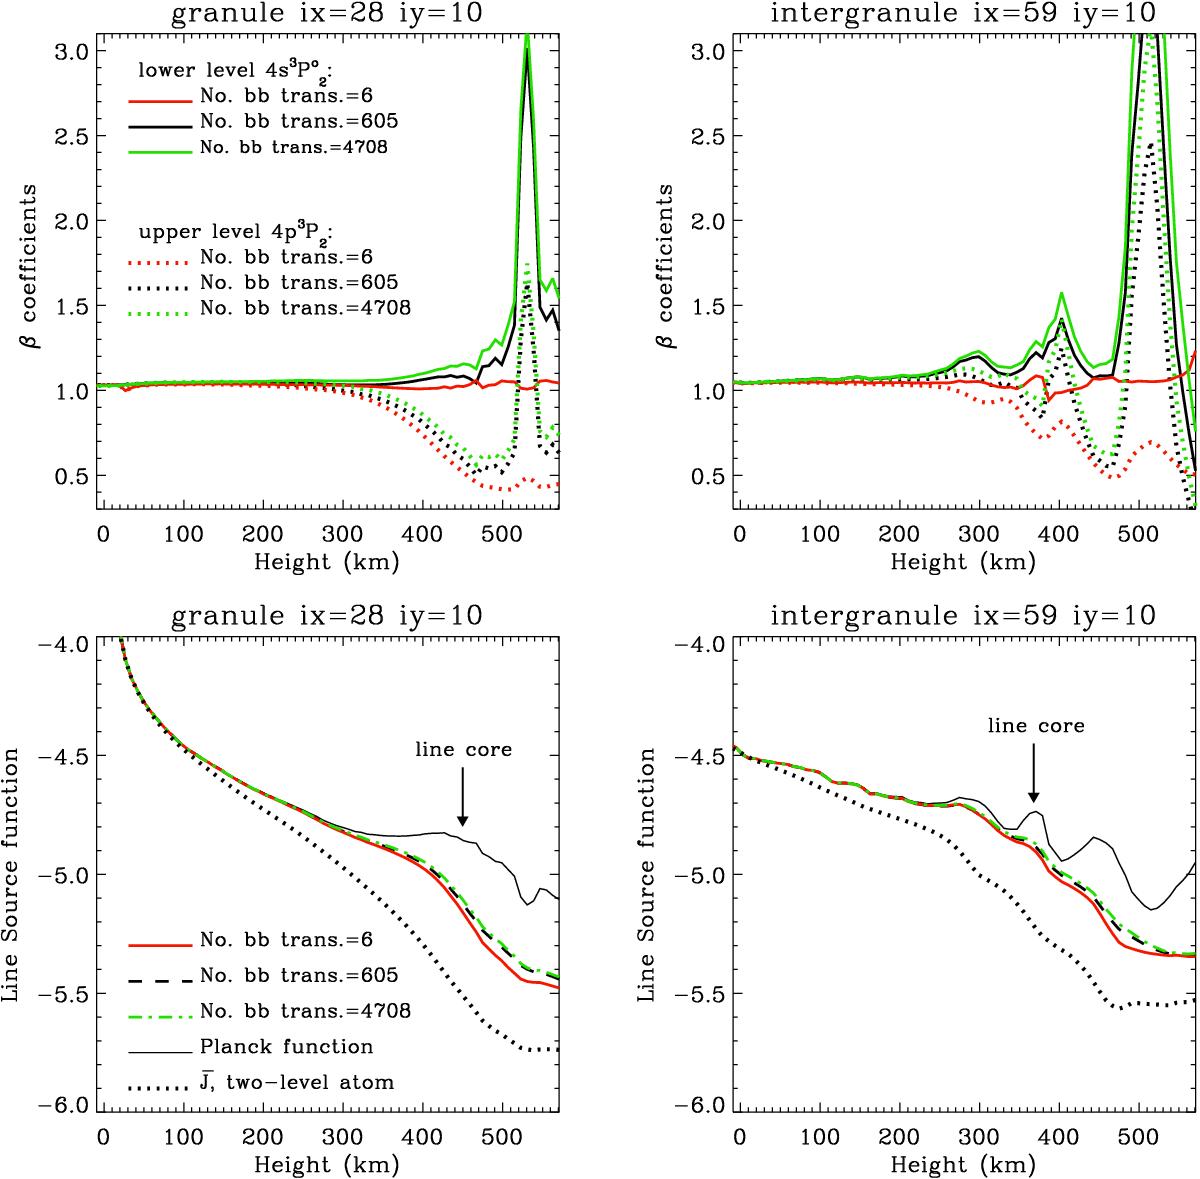
Top panels: departure coefficients β for the lower ![]() (solid lines) and the upper 4p 3P2 (dashed lines) levels of the Si i 10 827 Å line plotted against the atmospheric height. Bottom panels: the line source function Slu for the Stokes parameter I of the Si i 10 827 Å line versus height. The left and right panels show results for the granular and intergranular 1D models corresponding, respectively, to the spatial grid points (ix = 28, iy = 10) and (ix = 59, iy = 10) in the ⟨ | BZ | ⟩ = 80 G snapshot. Arrows mark the formation heights of the line core. The curves of different colors indicate the β and Slu values calculated using three different atomic models of the silicon atom. The black dotted curve shows the line source function for the two-level atom approximation, which is equal to the mean intensity
(solid lines) and the upper 4p 3P2 (dashed lines) levels of the Si i 10 827 Å line plotted against the atmospheric height. Bottom panels: the line source function Slu for the Stokes parameter I of the Si i 10 827 Å line versus height. The left and right panels show results for the granular and intergranular 1D models corresponding, respectively, to the spatial grid points (ix = 28, iy = 10) and (ix = 59, iy = 10) in the ⟨ | BZ | ⟩ = 80 G snapshot. Arrows mark the formation heights of the line core. The curves of different colors indicate the β and Slu values calculated using three different atomic models of the silicon atom. The black dotted curve shows the line source function for the two-level atom approximation, which is equal to the mean intensity ![]() averaged over the line profile. The black thin solid curve shows the Planck function. The scaling factor SH = 0.1.
averaged over the line profile. The black thin solid curve shows the Planck function. The scaling factor SH = 0.1.
Current usage metrics show cumulative count of Article Views (full-text article views including HTML views, PDF and ePub downloads, according to the available data) and Abstracts Views on Vision4Press platform.
Data correspond to usage on the plateform after 2015. The current usage metrics is available 48-96 hours after online publication and is updated daily on week days.
Initial download of the metrics may take a while.