Fig. 5
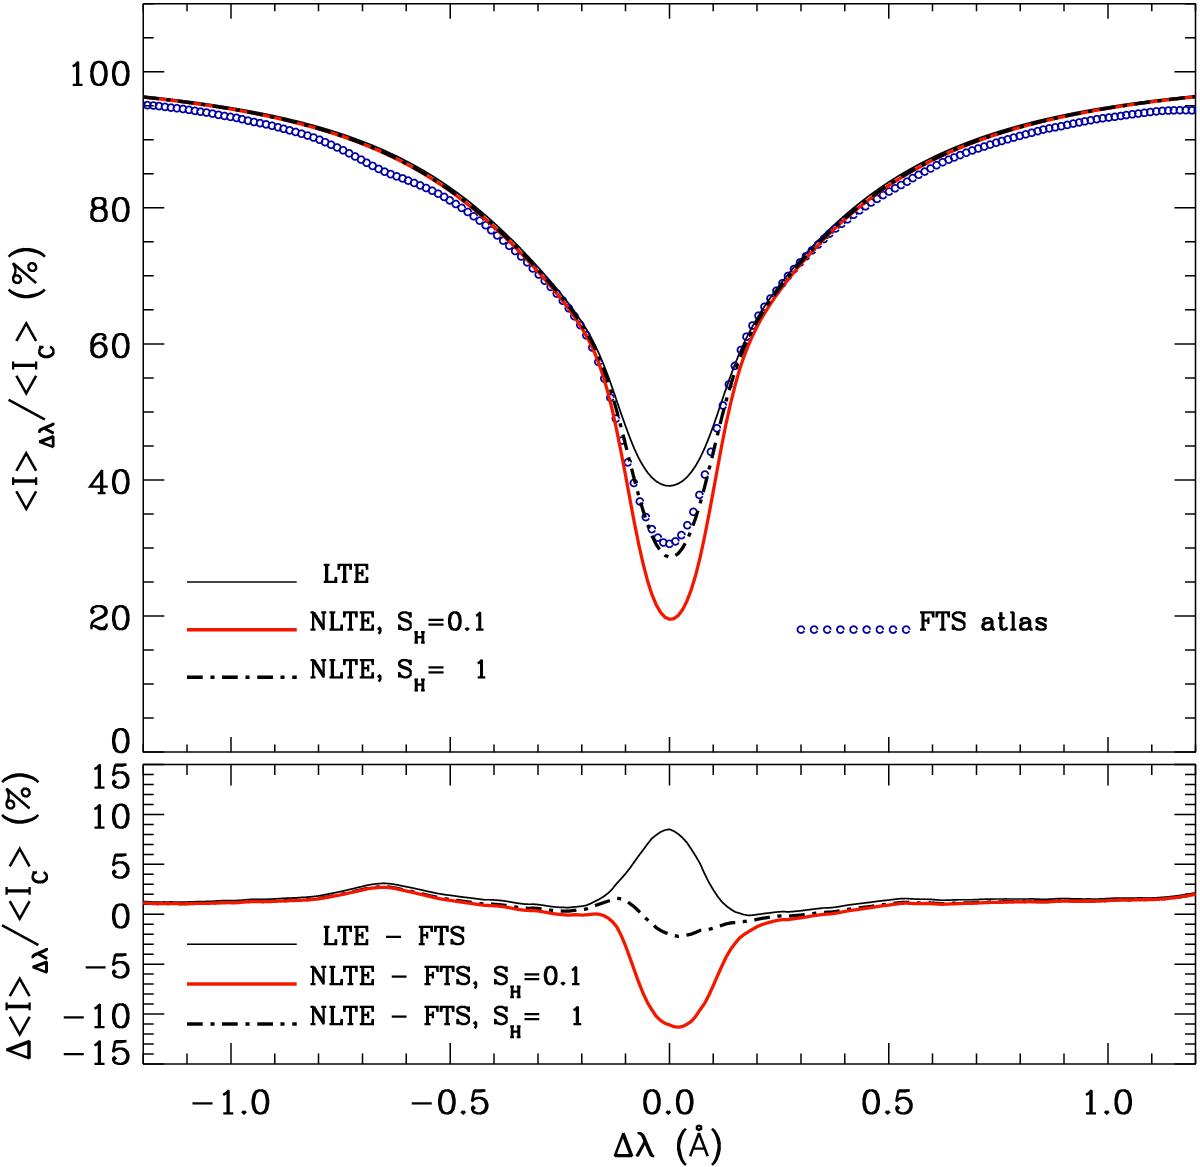
Top panel: calculated and observed intensity profiles of the Si i 10 827 Å line corresponding to the disk-center. Solid red and dashed-dotted black lines: spatially averaged NLTE profiles calculated in the 3D MHD snapshot, respectively, with a scaling factor SH = 0.1 and SH = 1. Thin solid line: the LTE profile. Small open blue circles: the observed profile from the FTS atlas (Neckel & Labs 1984; Neckel 1999). Bottom panel: differences between the synthetic and the observed profiles. The NLTE profiles are calculated using the simplest Si i model with six bb transitions (see Fig. 4, bottom right panel).
Current usage metrics show cumulative count of Article Views (full-text article views including HTML views, PDF and ePub downloads, according to the available data) and Abstracts Views on Vision4Press platform.
Data correspond to usage on the plateform after 2015. The current usage metrics is available 48-96 hours after online publication and is updated daily on week days.
Initial download of the metrics may take a while.