Fig. 4
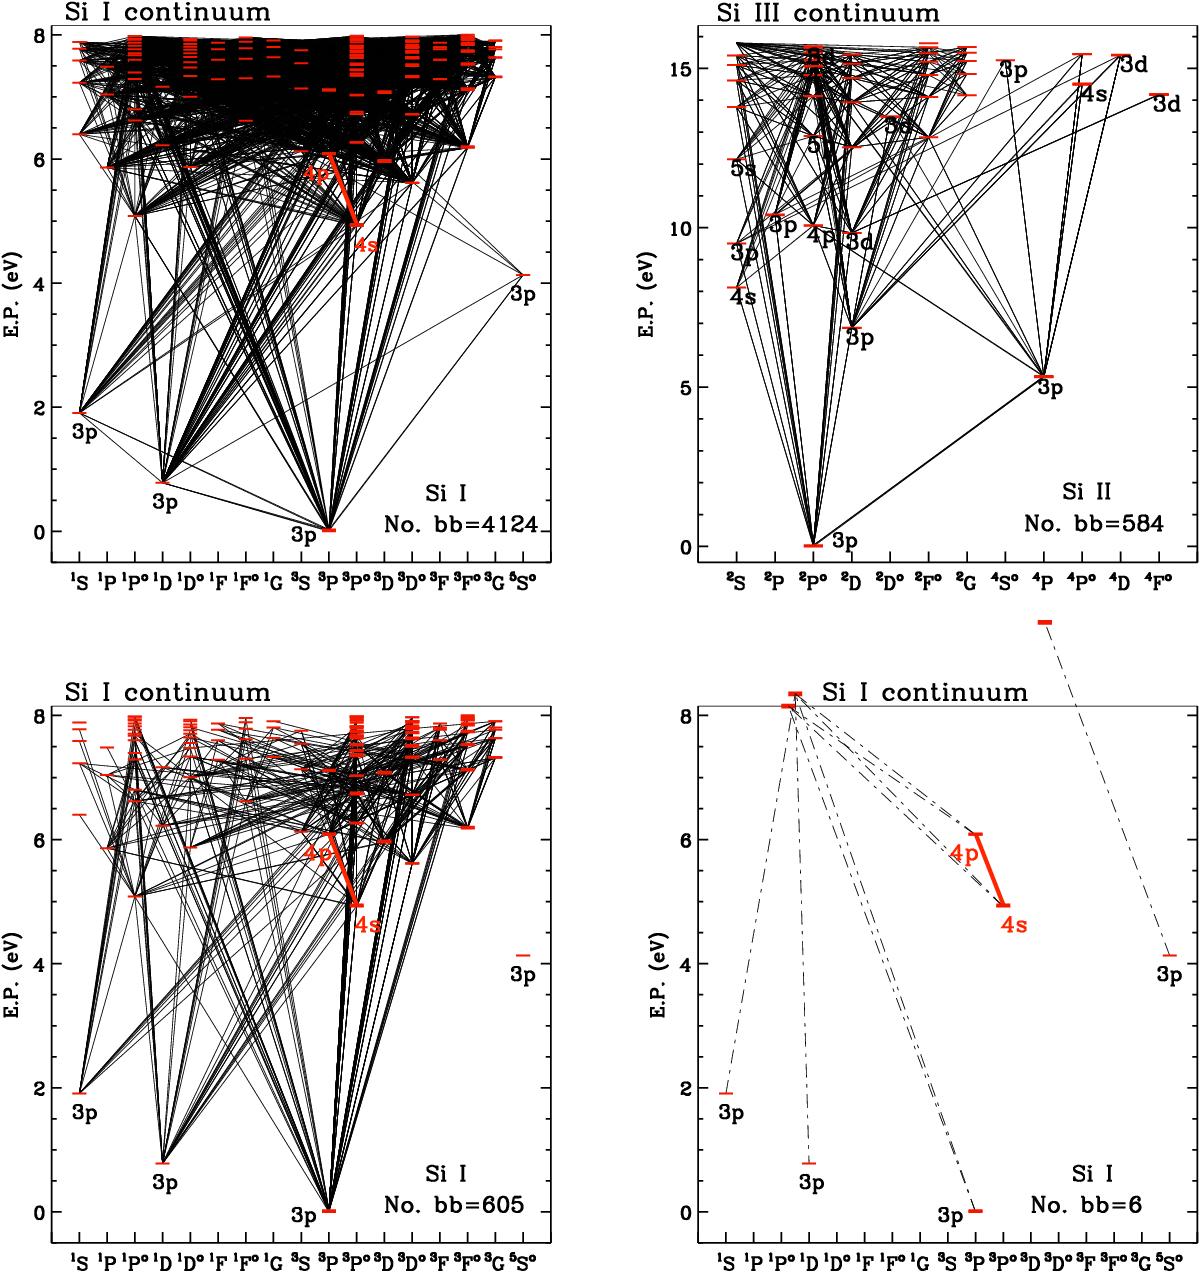
Diagram of the energy levels (red horizontal bars) and radiative transitions for the different model atoms of silicon. The number of bound-bound transitions in each model is indicated in the lower right corner of the panels. Top panel: the full, comprehensive model of Si i + Si ii atom. Note that the diagrams for the Si i and Si ii atoms are shown separately. Bottom panels: the Si i working model with 605 bb transitions (left) and the simplest one (right) with six bb transitions between the fine structure levels of the Si i lower 4s 3Po and upper 4p 3P terms. These bb transitions are marked by a thick red line. One of these transitions (![]() – 4p 3P2) gives rise to the Si i 10 827 Å line. Solid and dashed-dotted lines indicate, respectively, bb and bf radiative transitions. The bf transitions are shown only for the simplest model. See the main text for further information.
– 4p 3P2) gives rise to the Si i 10 827 Å line. Solid and dashed-dotted lines indicate, respectively, bb and bf radiative transitions. The bf transitions are shown only for the simplest model. See the main text for further information.
Current usage metrics show cumulative count of Article Views (full-text article views including HTML views, PDF and ePub downloads, according to the available data) and Abstracts Views on Vision4Press platform.
Data correspond to usage on the plateform after 2015. The current usage metrics is available 48-96 hours after online publication and is updated daily on week days.
Initial download of the metrics may take a while.