Fig. 14
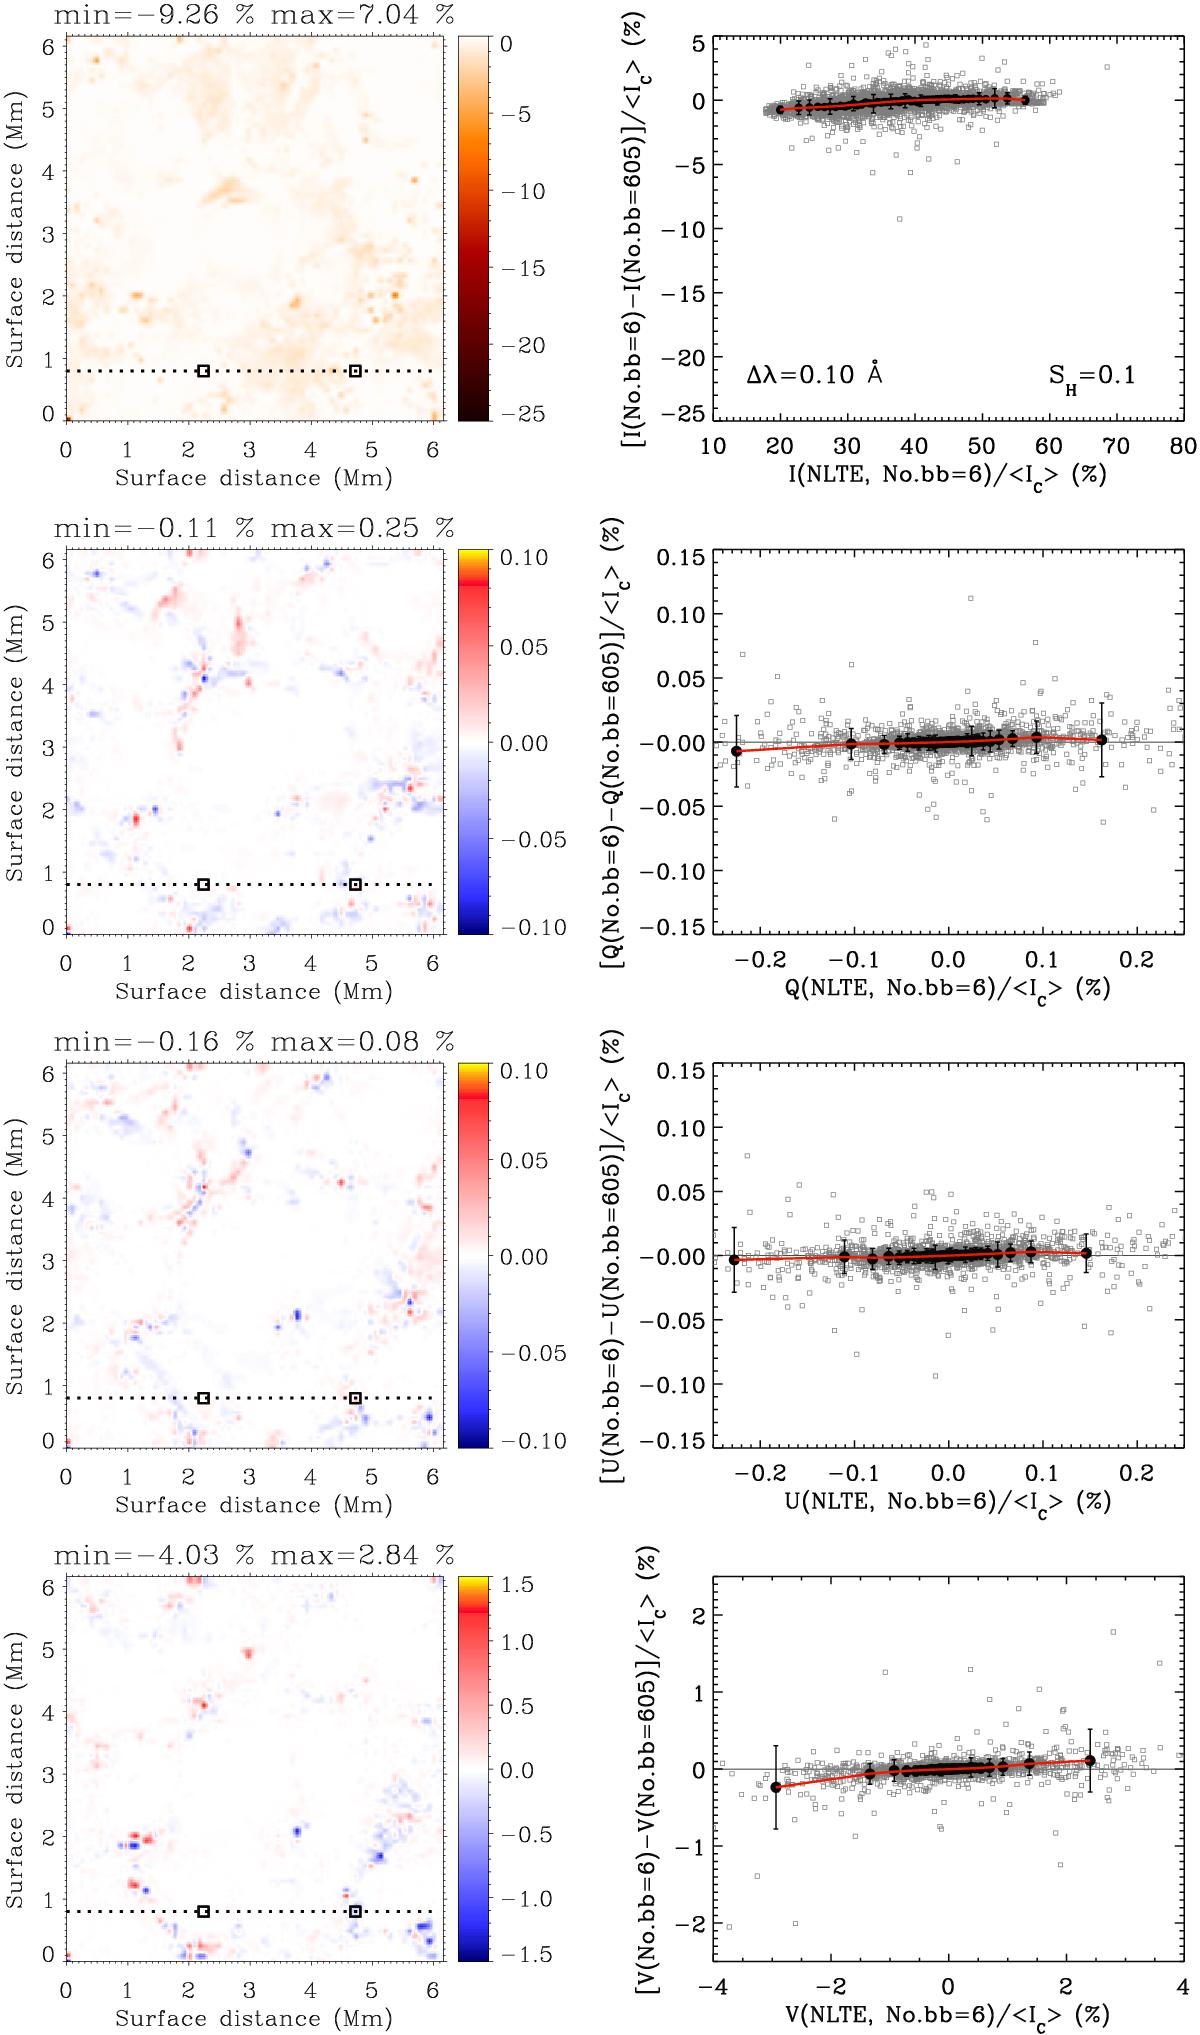
From top to bottom: changes of the NLTE Stokes profiles I, Q, U, and V of the Si i 10 827 Å line at the wavelength point Δλ = 0.10 Å caused by using different atomic models of Si i. Left: maps of the NLTE changes for the snapshot surface. Maximum and minimum values are shown at the top of each map. Right: scatter plots of the changes. The NLTE Stokes parameters are calculated by using the simplest Si i model with six bb transitions and the complicated model atom with 605 bb transitions (see the bottom left panel of Fig. 4). A horizontal thin line indicate a reference point for zero NLTE effects. For more information, see the caption of Fig. 11.
Current usage metrics show cumulative count of Article Views (full-text article views including HTML views, PDF and ePub downloads, according to the available data) and Abstracts Views on Vision4Press platform.
Data correspond to usage on the plateform after 2015. The current usage metrics is available 48-96 hours after online publication and is updated daily on week days.
Initial download of the metrics may take a while.