Fig. 13
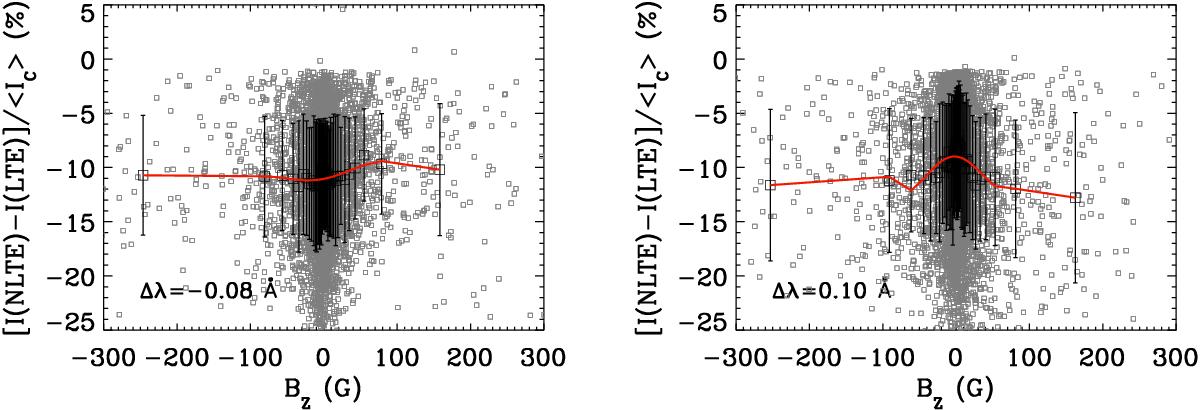
NLTE changes of the emergent Stokes I profiles in the blue and red wings of the Si i 10 827 Å line versus the vertical magnetic field component BZ. Left: results for the blue wing at Δλ = −0.08 Å. Right: results for the right wing at Δλ = 0.10 Å. The NLTE intensity profiles are calculated using the simplest Si i model with six bb transitions and assuming SH = 0.1. For more information, see the caption of Fig. 12.
Current usage metrics show cumulative count of Article Views (full-text article views including HTML views, PDF and ePub downloads, according to the available data) and Abstracts Views on Vision4Press platform.
Data correspond to usage on the plateform after 2015. The current usage metrics is available 48-96 hours after online publication and is updated daily on week days.
Initial download of the metrics may take a while.