Fig. 11
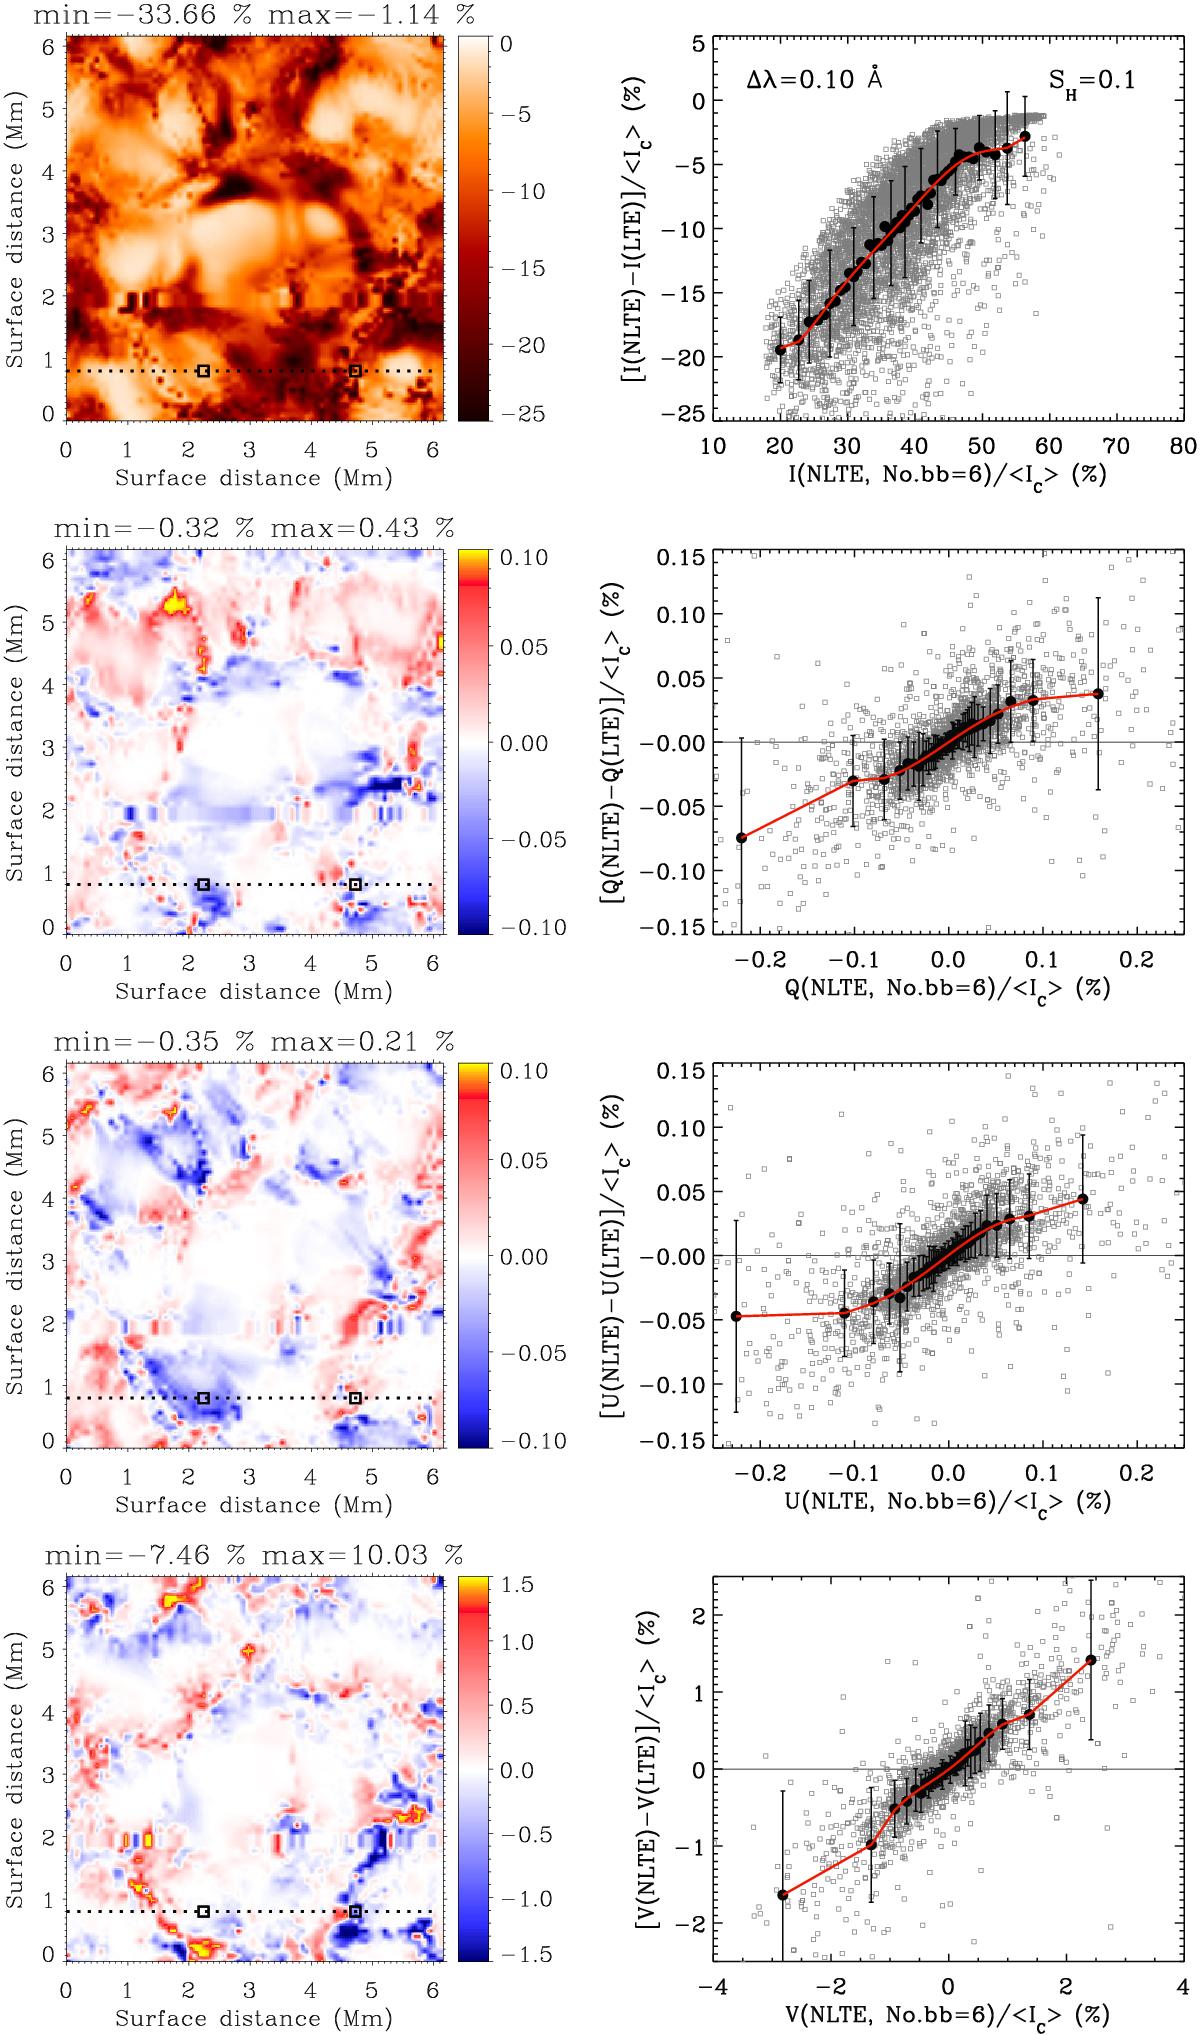
From top to bottom: changes of the emergent Stokes profiles I, Q, U, and V of the Si i 10 827 Å line at the wavelength Δλ = 0.10 Å caused by the NLTE effects in the 3D snapshot model. Left: maps of the NLTE changes across surface of the 3D snapshot model. Maximum and minimum values are shown at the top of each map. The horizontal dotted line corresponds to the slice iy = 10. The squares mark two surface positions: a granule at ix = 28 and an intergranule at ix = 59. Right: scatter plots of the NLTE changes. Black circles and vertical lines indicate averages and error bars, correspondingly, over bins with 50 surface points. Red curves represent the sixth-degree polynomial fit to these averages. The NLTE Stokes parameters have been calculated by using the scaling factor SH = 0.1 and the simplest Si i model with six bb transitions (see Fig. 4, bottom right panel). The horizontal thin line indicates a reference point for zero NLTE effects.
Current usage metrics show cumulative count of Article Views (full-text article views including HTML views, PDF and ePub downloads, according to the available data) and Abstracts Views on Vision4Press platform.
Data correspond to usage on the plateform after 2015. The current usage metrics is available 48-96 hours after online publication and is updated daily on week days.
Initial download of the metrics may take a while.