Fig. 1
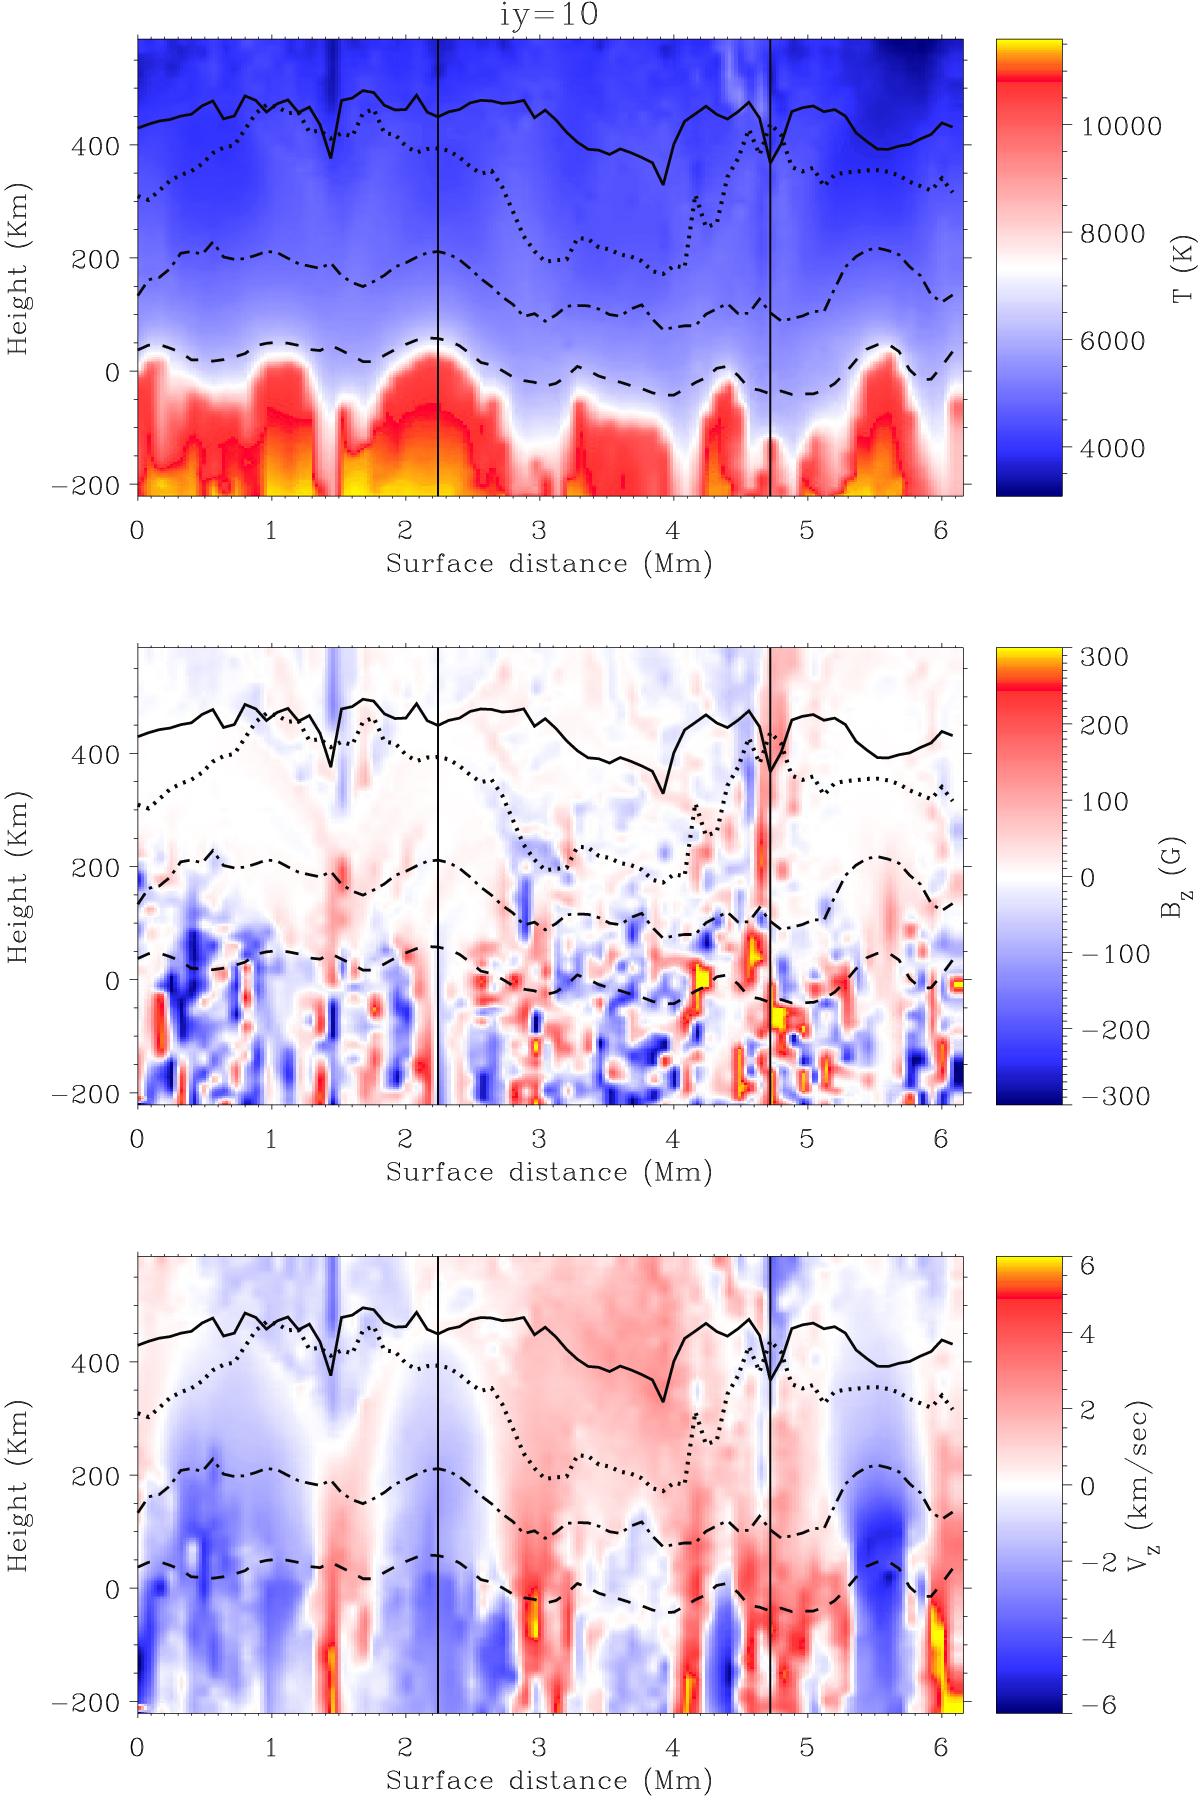
Top panel: height variation of the temperature along the slice corresponding to the spatial grid point iy = 10 in the 3D snapshot model with vertical unsigned flux density ⟨ | BZ | ⟩ = 80 G. Middle panel: height variation of the vertical magnetic field strength BZ along the same slice. Bottom panel: height variation of the vertical velocity VZ. Curves show the horizontal fluctuations of the formation height HΔλ of the Si i 10 827 Å line derived using the Eddington-Barbier approximation. Thick solid curve: Δλ = 0; dotted curve: Δλ = −0.08 Å; dash-dotted curve: Δλ = −0.2 Å. Dashed curve indicates the formation height of the line continuum. Two vertical lines correspond to the grid points ix = 28 (a granule) and ix = 59 (an intergranule).
Current usage metrics show cumulative count of Article Views (full-text article views including HTML views, PDF and ePub downloads, according to the available data) and Abstracts Views on Vision4Press platform.
Data correspond to usage on the plateform after 2015. The current usage metrics is available 48-96 hours after online publication and is updated daily on week days.
Initial download of the metrics may take a while.