Fig. 5
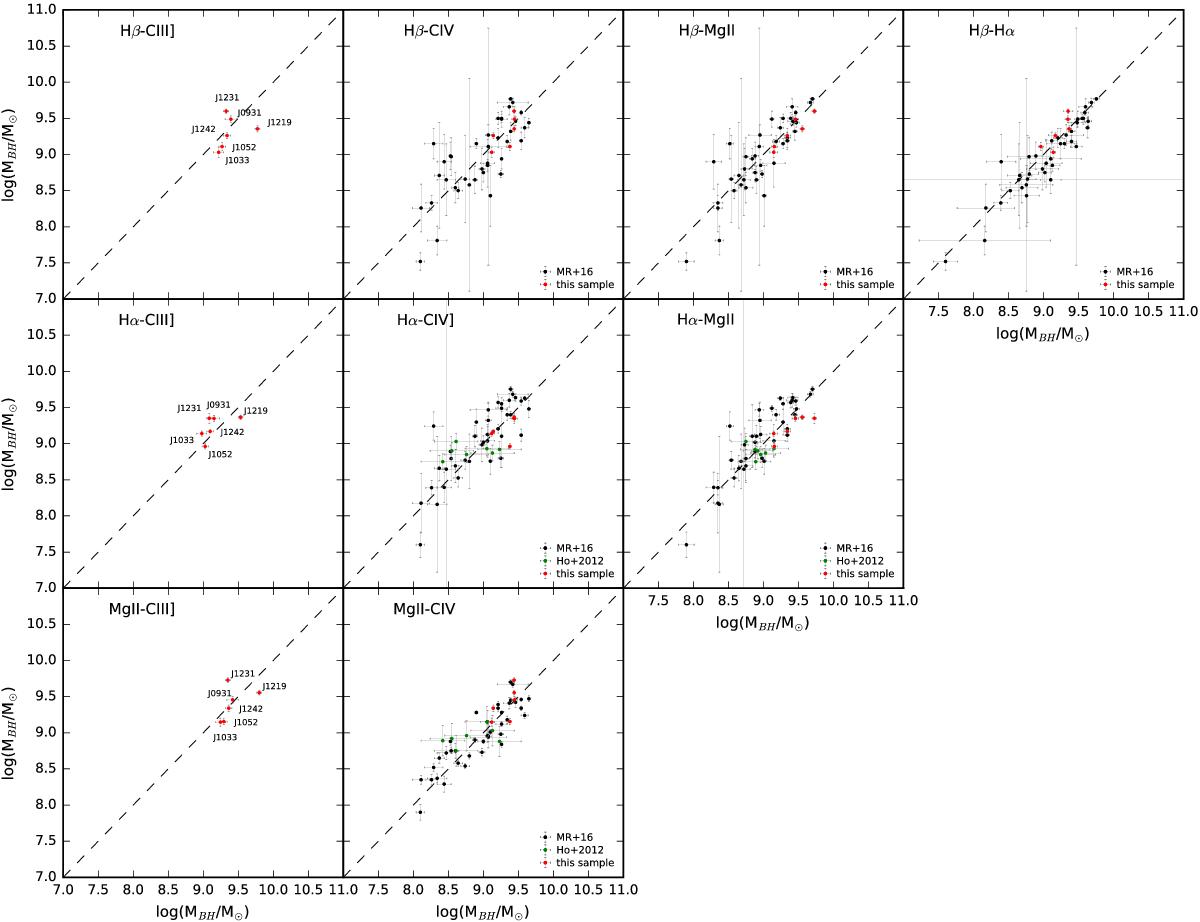
Correlations between virial masses. The lines labelled in the upper left of every panel refer to Y and X axis respectively. 1st column: correlations between C iii]-based virial masses and masses derived from the other lines. The black dashed line represents the 1:1 relation. Intercept and scatter for all the relations are given in Table 6. 2nd, 3rd and 4th columns: MBH measurements for Mejia-Restrepo et al. (2016, (black points), Ho et al. (2012, green points) and this work (red points) samples obtained with the prescriptions by Mejia-Restrepo et al. (2016, see the main text for details on the used prescriptions and the luminosities). Black dashed lines represent the 1:1 relation. MBH estimates for our sources are given in Table 5.
Current usage metrics show cumulative count of Article Views (full-text article views including HTML views, PDF and ePub downloads, according to the available data) and Abstracts Views on Vision4Press platform.
Data correspond to usage on the plateform after 2015. The current usage metrics is available 48-96 hours after online publication and is updated daily on week days.
Initial download of the metrics may take a while.