Fig. 4
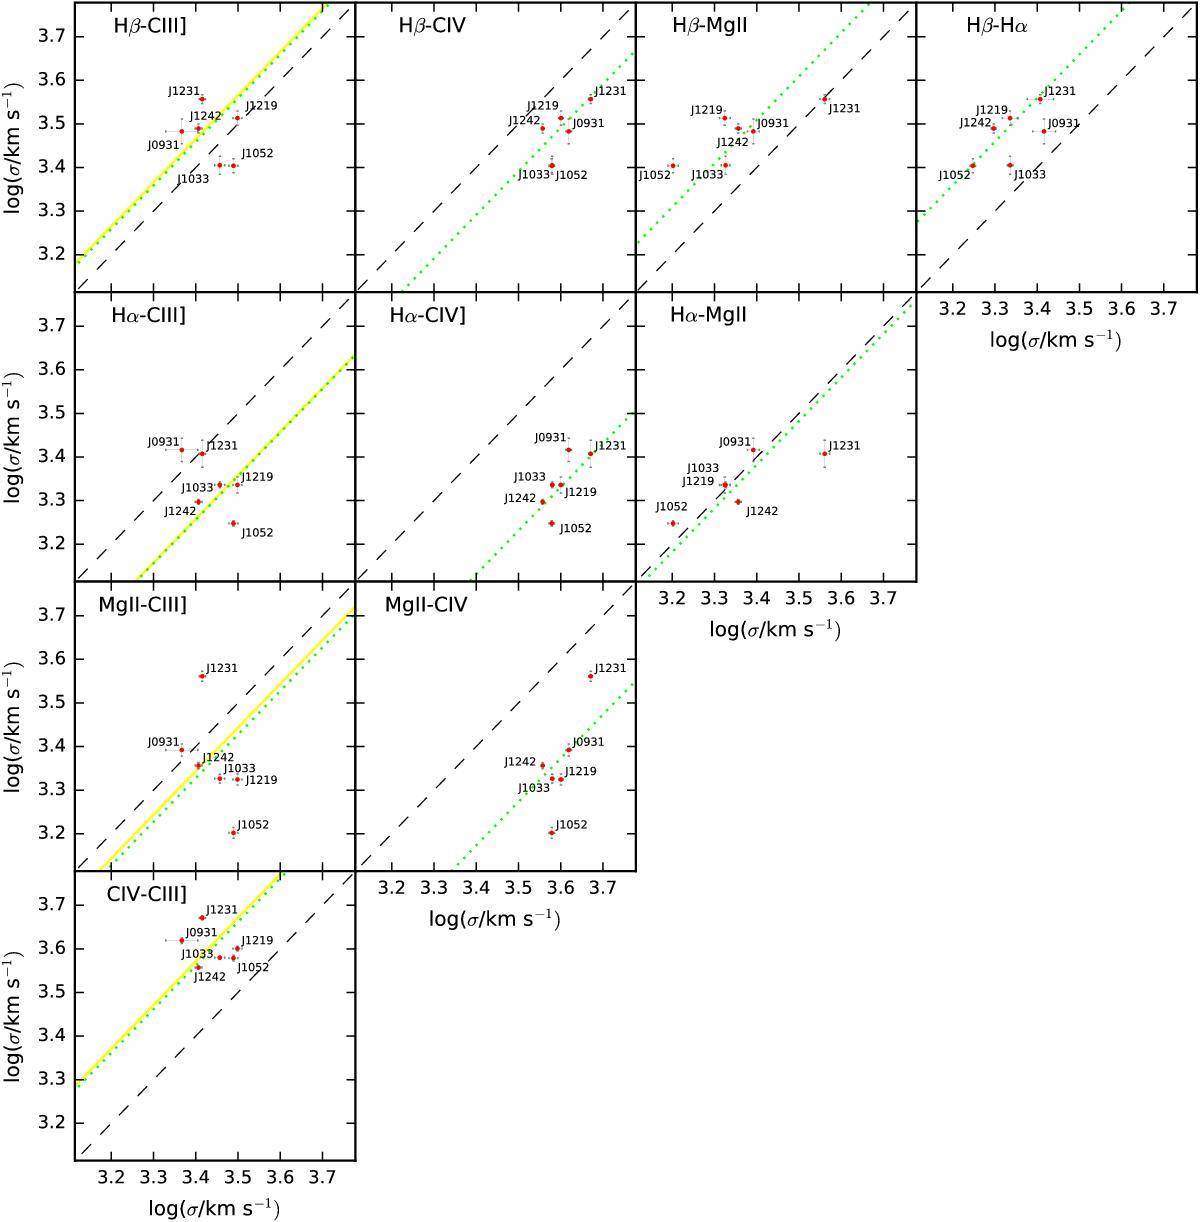
Line dispersion correlations between line pairs. The lines labelled in the upper left of every panel refer to Y and X axis respectively. 1st column: correlations for the C iii] line. The black dashed line represents the 1:1 relation, while the light green one represents the best fit to our data, considering a linear relation between the line dispersions. The function we fit is log(σ1)= m·log(σ2)+ c, with m = 1. The solid yellow line is the best fit when not considering J121911 in the sample. Intercept and scatter for all the relations are given in Table 6. 2nd, 3rd and 4th columns: correlations for all the lines commonly considered in virial estimation. The black dashed line represents the 1:1 relation, while the light green one represents the bestfit for our data (red points), considering a linear relation between the line dispersions for every pair of lines. The function we fit is log (σ1) = m·log (σ2) + c, where the slope m = 1. Intercept and scatter for all the relations are reported in Table 4.
Current usage metrics show cumulative count of Article Views (full-text article views including HTML views, PDF and ePub downloads, according to the available data) and Abstracts Views on Vision4Press platform.
Data correspond to usage on the plateform after 2015. The current usage metrics is available 48-96 hours after online publication and is updated daily on week days.
Initial download of the metrics may take a while.