Fig. 3
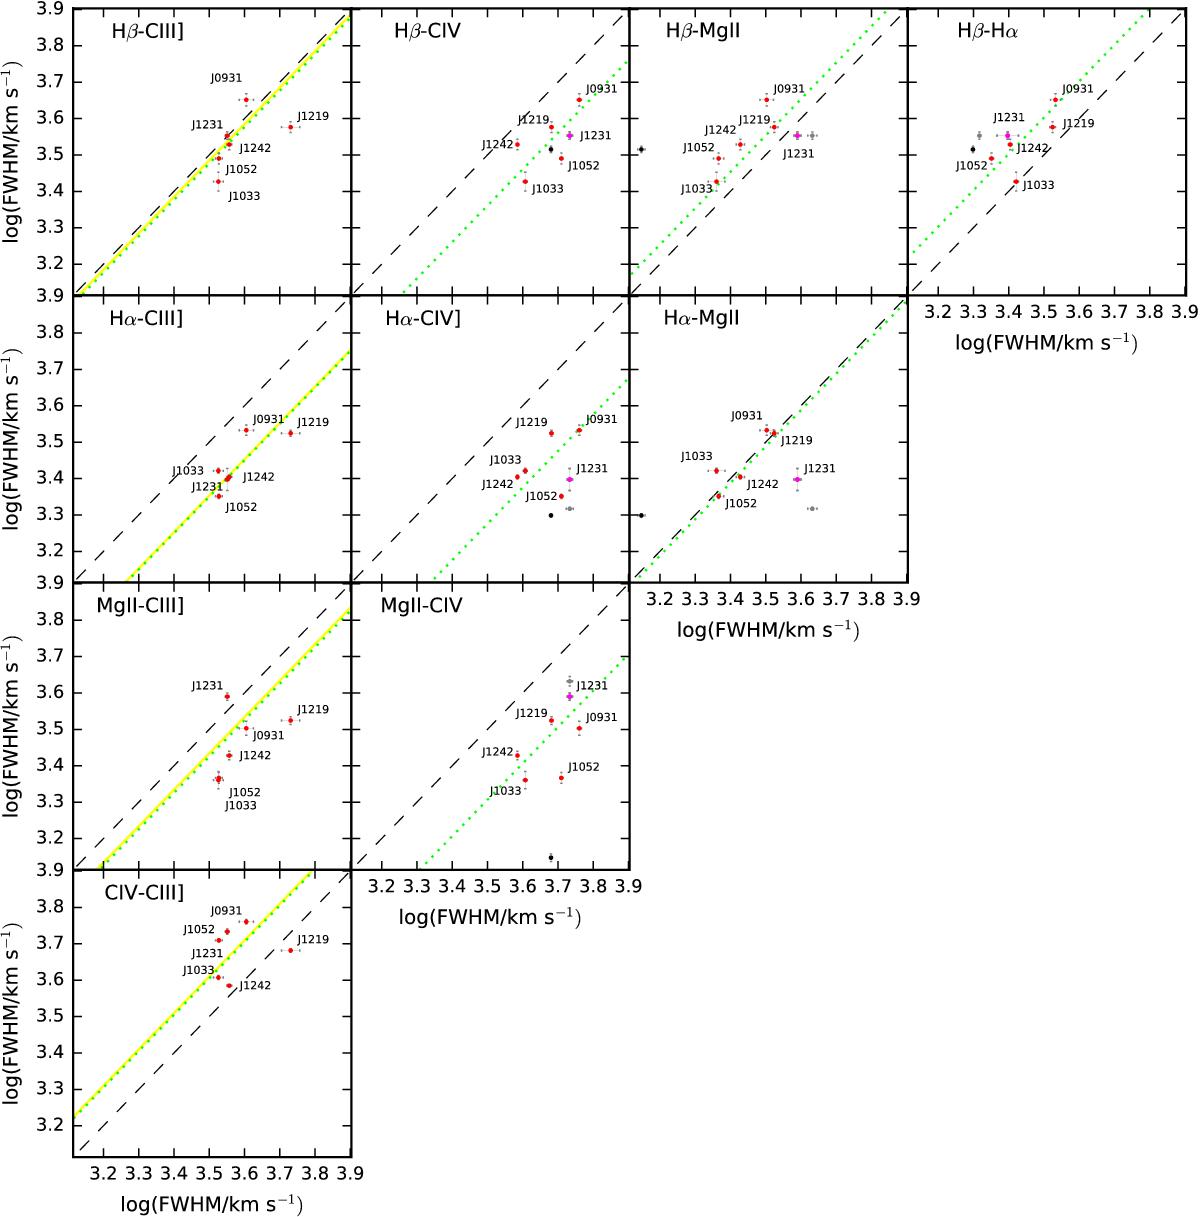
FWHM correlations between line pairs. The lines labelled in the upper left of every panel refer to Y and X axis respectively. 1st column: correlations for the C iii] line. The black dashed line represents the 1:1 relation, while the light green one represents the best fit to our data, considering a linear relation between the logarithm of the FWHM for every pair of lines. The solid yellow line is the best fit when not considering J121911 in the sample. Intercept and scatter for all the relations are given in Table 6. In the case of relations involving C iii], we do not plot the different measurements for linewidths of J123120 (i.e. broad lines only vs. broad and narrow lines considered in the fit). As in the case of the other lines, however, we take into account the FWHM measurements pertaining to the broad component when the narrow component is present. 2nd, 3rd and 4th columns: correlations for all the lines commonly considered in virial estimates. The red and magenta points are the measurements used in the final analysis. The black point represents the measurement taking into account only broad components for J123120, while the magenta point is the measurement including also narrow components in the fit and used in the final analysis. The grey point is the alternative measurement including the narrow component that we did not choose to use (refer to main text for details). The black dashed line represents the 1:1 relation, while the light green one represents the bestfit to our data (red and magenta points), considering a linear relation between the logarithms of the FWHM for every pair of lines. Intercept and scatter for all the relations are reported in Table 4.
Current usage metrics show cumulative count of Article Views (full-text article views including HTML views, PDF and ePub downloads, according to the available data) and Abstracts Views on Vision4Press platform.
Data correspond to usage on the plateform after 2015. The current usage metrics is available 48-96 hours after online publication and is updated daily on week days.
Initial download of the metrics may take a while.