Table A.1
Simulation of the effects of radial velocity variations on the estimation of the projected rotational velocity from the Si iii line at 4552 Å.
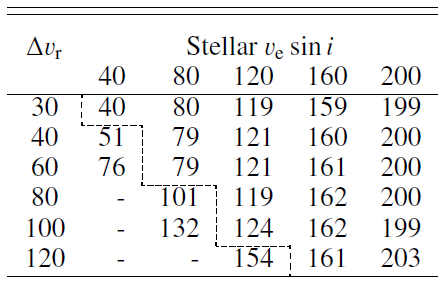
Notes. Dashes indicate that the profile appear double peaked and no attempt to estimate a projected rotational velocity was attempted. The region where the estimates should be reliable is at the upper right and is delineated by dotted lines. All values are in km s-1.
Current usage metrics show cumulative count of Article Views (full-text article views including HTML views, PDF and ePub downloads, according to the available data) and Abstracts Views on Vision4Press platform.
Data correspond to usage on the plateform after 2015. The current usage metrics is available 48-96 hours after online publication and is updated daily on week days.
Initial download of the metrics may take a while.