Fig. 5
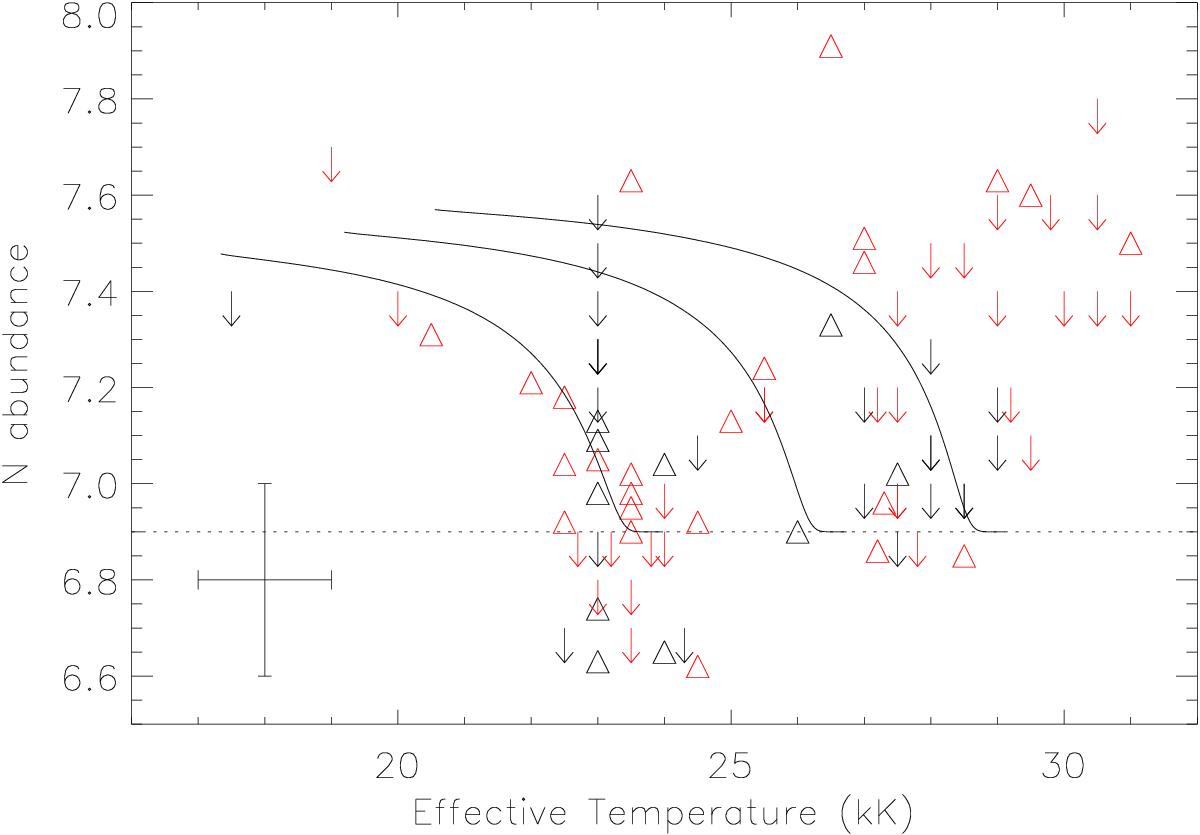
Nitrogen abundance estimates (triangles) and upper limits (arrows) assuming no secondary flux contribution are plotted against effective-temperature estimates for our binary sample (black symbols). The representative error bars are for targets listed in Table 3, with those for targets from Table 4 being larger – see text for details. Also shown are the single-star sample discussed in Sect. 4.4.2 (red symbols – some targets have been moved slightly in effective temperature in order to improve clarity). The dotted line represents a baseline LMC abundance of 6.9 dex. The solid lines are evolutionary models from Brott et al. (2011a) with initial masses of 8, 10 and 12 M⊙ and an initial equatorial rotational velocity of approximately 230 km s-1.
Current usage metrics show cumulative count of Article Views (full-text article views including HTML views, PDF and ePub downloads, according to the available data) and Abstracts Views on Vision4Press platform.
Data correspond to usage on the plateform after 2015. The current usage metrics is available 48-96 hours after online publication and is updated daily on week days.
Initial download of the metrics may take a while.