Fig. 4
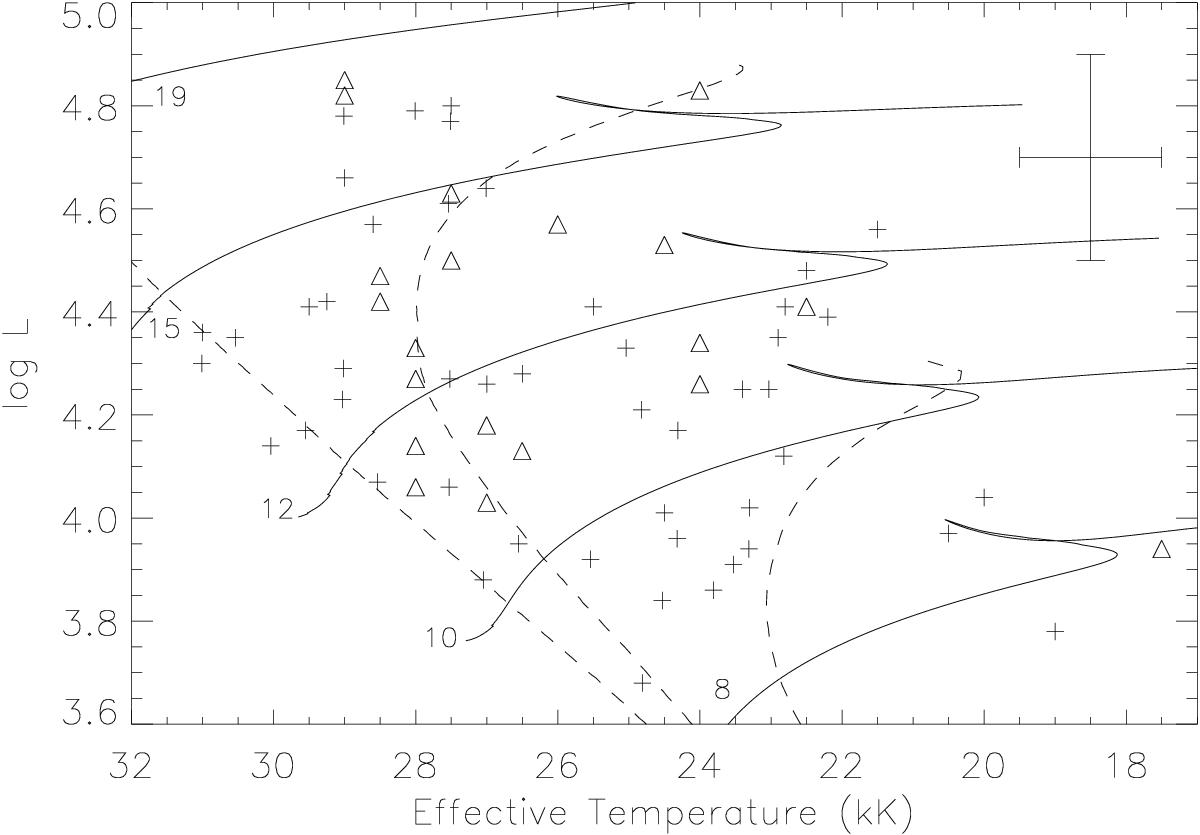
Luminosity estimates (in units of the solar luminosity) plotted against effective-temperature estimates for our binary sample in Table 3 (triangles), together with representative error bars. Also shown are the single-star sample discussed in Sect. 4.4.2 (crosses – some targets have been moved slightly in effective temperature or gravity in order to improve clarity). Evolutionary models (solid lines) of Brott et al. (2011a) are shown for zero initial rotational velocity together with the initial mass (in units of the solar mass). Isochrones (dashed lines) are shown for ages of 5, 10 and 20 Myr.
Current usage metrics show cumulative count of Article Views (full-text article views including HTML views, PDF and ePub downloads, according to the available data) and Abstracts Views on Vision4Press platform.
Data correspond to usage on the plateform after 2015. The current usage metrics is available 48-96 hours after online publication and is updated daily on week days.
Initial download of the metrics may take a while.