| Issue |
A&A
Volume 603, July 2017
|
|
|---|---|---|
| Article Number | A39 | |
| Number of page(s) | 13 | |
| Section | Stellar structure and evolution | |
| DOI | https://doi.org/10.1051/0004-6361/201629731 | |
| Published online | 04 July 2017 | |
XMM-Newton and INTEGRAL view of the hard state of EXO 1745−248 during its 2015 outburst
1 Università degli Studi di Palermo, Dipartimento di Fisica e Chimica, via Archirafi 36, 90123 Palermo, Italy
e-mail: This email address is being protected from spambots. You need JavaScript enabled to view it.
2 INAF, Osservatorio Astronomico di Roma, via di Frascati 33, 00044 Monte Porzio Catone (Roma) , Italy
3 ISDC Data Centre for Astrophysics, Chemin d’Ecogia 16, 1290 Versoix, Switzerland
4 Institut de Ciéncies de l’Espai (IEEC-CSIC), Campus UAB, Carrer de Can Magrans s/n, 08193 Barcelona, Spain
5 Università degli Studi di Cagliari, Dipartimento di Fisica, SP Monserrato-Sestu KM 0.7, 09042 Monserrato, Italy
6 Osservatorio Astronomico di Capodimonte, via Moiarello 16, 80131 Napoli, Italy
7 European Space Astronomy Centre (ESA/ESAC), Science Operations Department, 28691 Villanueva de la Cañada Madrid, Spain
8 Anton Pannekoek Institute for Astronomy, University of Amsterdam, Postbus 94249, 1090 GE Amsterdam, The Netherlands
Received: 16 September 2016
Accepted: 20 March 2017
Abstract
Context. Transient low-mass X-ray binaries (LMXBs) often show outbursts that typically last a few weeks and are characterized by a high X-ray luminosity (Lx ≈ 1036−1038 erg s-1), while most of the time they are found in X-ray quiescence (LX ≈ 1031−1033 erg s-1). The source EXO 1745−248 is one of them.
Aims. The broad-band coverage and sensitivity of the instrument on board XMM-Newton and INTEGRAL offers the opportunity of characterizing the hard X-ray spectrum during the outburst of EXO 1745−248.
Methods. We report on quasi-simultaneous XMM-Newton and INTEGRAL observations of the X-ray transient EXO 1745−248 located in the globular cluster Terzan 5, performed ten days after the beginning of the outburst (on 2015 March 16) of the source between March and June 2015. The source was caught in a hard state, emitting a 0.8−100 keV luminosity of ≃ 1037 erg s-1.
Results. The spectral continuum was dominated by thermal Comptonization of seed photons with temperature kTin ≃ 1.3 keV, by a cloud with a moderate optical depth τ ≃ 2, and with an electron temperature of kTe ≃ 40 keV. A weaker soft thermal component at temperature kTth ≃ 0.6−0.7 keV and compatible with a fraction of the neutron star radius was also detected. A rich emission line spectrum was observed by the EPIC-pn on board XMM-Newton; features at energies compatible with K-α transitions of ionized sulfur, argon, calcium, and iron were detected, with a broadness compatible with either thermal Compton broadening or Doppler broadening in the inner parts of an accretion disk truncated at 20 ± 6 gravitational radii from the neutron star. Strikingly, at least one narrow emission line ascribed to neutral or mildly ionized iron is needed to model the prominent emission complex detected between 5.5 and 7.5 keV. The different ionization state and broadness suggest an origin in a region located farther from the neutron star than where the other emission lines are produced. Seven consecutive type I bursts were detected during the XMM-Newton observation, none of which showed hints of photospheric radius expansion. A thorough search for coherent pulsations from the EPIC-pn light curve did not result in any significant detection. Upper limits ranging from a few to 15% on the signal amplitude were set, depending on the unknown spin and orbital parameters of the system.
Key words: techniques: spectroscopic / stars: neutron / X-rays: binaries / X-rays: bursts / X-rays: individuals: EXO 1745−248
© ESO, 2017
1. Introduction
Globular clusters are ideal sites for the formation of binary systems hosting a compact object thanks to the frequent dynamical interaction caused by their dense environment (Meylan & Heggie 1997). Low-mass X-ray binaries (LMXB) formed by a neutron star (NS) that accretes matter lost by a companion low-mass star are particularly favored, as stellar encounters may cause the lower mass star of a binary to be replaced by a heavier NS (Verbunt & Hut 1987). Some of the densest and most massive globular clusters have the highest predicted rates of stellar interactions and host a numerous population of LMXBs (Heinke et al. 2003b).
Terzan 5 is a compact massive cluster at a distance of 5.5 kpc (Ortolani et al. 2007) that hosts at least three stellar populations with different iron abundances; the observed chemical pattern suggests that it was much more massive in the past, so it is able to hold the iron-rich ejecta of past supernova explosions (Ferraro et al. 2009; Origlia et al. 2013; Ferraro et al. 2016). Terzan 5 has the highest stellar interaction rate of any cluster in the Galaxy (Verbunt & Hut 1987; Heinke et al. 2003a; Bahramian et al. 2013). This translates into the largest population known of millisecond radio pulsars (34; Ransom et al. 2005; Hessels et al. 2006) and at least 50 X-ray sources, including a dozen likely quiescent LMXBs (Heinke et al. 2006). The populations of millisecond radio pulsars and LMXBs are linked from an evolutionary point of view, as mass accretion in an LMXB is expected to speed up the rotation of an NS to a spin period of a few milliseconds (Alpar et al. 1982). This link was confirmed by the discovery of accreting millisecond pulsars (AMSPs; Wijnands & van der Klis 1998) and by the observations of binary millisecond pulsars swinging between a radio pulsar and an accretion disk state on timescales that can be as short as weeks (Archibald et al. 2009; Papitto et al. 2013b; Bassa et al. 2014). Globular clusters like Terzan 5 are preferential laboratories to study the relation between these two classes of sources.
Many LMXBs are X-ray transients; they show outbursts that typically last a few weeks and are characterized by a high X-ray luminosity (Lx ≈ 1036−1038 erg s-1), while most of the time they are found in X-ray quiescence (LX ≈ 1031−1033 erg s-1). X-ray transient activity has frequently been observed from Terzan 5 since the 1980s (Makishima et al. 1981; Warwick et al. 1988; Verbunt et al. 1995), and ten outbursts have been detected since then (see, e.g., Table 1 in Degenaar & Wijnands 2012). The large number of possible counterparts in the cluster complicates the identification of the transient responsible for each event when a high spatial resolution X-ray (or radio) observation was not available. As a consequence, only three X-ray transients of Terzan 5 have been securely identified, EXO 1745−248 (Terzan 5 X–1, active in 2000, 2011, and 2015; Makishima et al. 1981; Markwardt & Swank 2000; Heinke et al. 2003a; Serino et al. 2012; Tetarenko et al. 2016), IGR J17480–2446 (Terzan 5 X–2, active in 2010; Papitto et al. 2011; Motta et al. 2011) and Swift J174805.3–244637 (Terzan 5 X–3, active in 2012; Bahramian et al. 2014).
The first confirmed outburst observed from EXO 1745−248 took place in 2000, when a Chandra observation could pin down the location of the X-ray transient with subarcsecond accuracy (Heinke et al. 2003a). The outburst lasted ~ 100 d, showing a peak of X-ray luminosity1~ 6 × 1037 erg s-1 (Degenaar & Wijnands 2012). The X-ray spectrum was dominated by thermal Comptonization in a cloud with a temperature ranging between a few and tens of keV (Heinke et al. 2003a; Kuulkers et al. 2003), a thermal component at energies of ≈ 1 keV, and a strong emission line at energies compatible with the Fe K-α transition was also present in the spectrum. More than 20 type I X-ray bursts were observed, in none of which burst oscillations could be detected (Galloway et al. 2008). Two of these bursts showed evidence of photospheric radius expansion and were considered by Özel et al. (2009) to place constraints on the mass and radius of the NS. A second outburst was observed from EXO 1745−248 in 2011, following the detection of a superburst characterized by a decay timescale of ≈ 10 h (Altamirano et al. 2012; Serino et al. 2012). The outburst lasted ≈ 20 d, reaching an X-ray luminosity of 9 × 1036 erg s-1. Degenaar & Wijnands (2012) found strong variability of the X-ray emission observed during quiescence between the 2000 and the 2011 outburst, possibly caused by low-level residual accretion.
A new outburst from Terzan 5 was detected on 2015 March 13 (Altamirano et al. 2015). It was associated with EXO 1745−248 based on the coincidence between its position (Heinke et al. 2006) and the location of the X-ray source observed by Swift/XRT (Linares et al. 2015), and also of the radio counterpart detected by the Karl G. Jansky Very Large Array (VLA; Tremou et al. 2015), with an accuracy of 2.2 and 0.4 arcsec, respectively. The outburst lasted ≈ 100 d and attained a peak X-ray luminosity of 1038 erg s-1, roughly a month into the outburst (Tetarenko et al. 2016). The source performed a transition from hard state (characterized by an X-ray spectrum described by a power law with photon index ranging from 0.9 to 1.3) to soft state (in which the spectrum was thermal with a temperature of ≈ 2−3 keV) a few days before reaching the peak flux (Yan et al. 2015). The source transitioned back to the hard state close to the end of the outburst. Tetarenko et al. (2016) showed that throughout the outburst the radio and X-ray luminosity correlated as  with
with  , indicating a link between the compact jet traced by the radio emission and the accretion flow traced by the X-ray output. The optical counterpart was identified by Ferraro et al. (2015), who detected the optical brightening associated with the outburst onset in Hubble Space Telescope images; the location of the companion star in the color-magnitude diagram of Terzan 5 is consistent with the main-sequence turnoff. We stress that the HST study suggests that EXO 1745−248 is in an early phase of accretion stage with the donor expanding and filling its Roche lobe, thus representing a prenatal stage of a millisecond pulsar binary. This would make the study of this source more interesting and would also link what we stated above regarding rotation-powered MSPs and AMSPs.
Here we present an analysis of the X-ray properties of EXO 1745−248, based on an XMM-Newton observation performed ≈ 10 days into the 2015 outburst, when the source was in the hard state.
The main goal of this paper is to observe the region of the spectrum around the iron line with better statistics. By adding the broadband coverage allowed by INTEGRAL observations, we are then able to study the possible associated reflection features and give a definite answer on the origin of the iron line. We also make use of additional monitoring observations of the source carried out with INTEGRAL during its 2015 outburst to spectroscopically confirm the hard-to-soft spectral state transition displayed by EXO 1745−248 around 57 131 MJD (as previously reported by Tetarenko et al. 2016). We stress that this transition was observed by Swift. In order to understand the physical properties of this state, we performed an observation with XMM-Newton allowing more sensitive and higher resolution data. We focus in Sect. 3 on the shape of the X-ray spectrum and in Sect. 4 on the properties of the temporal variability, while an analysis of the X-ray bursts observed during the considered observations is presented in Sect. 5.
2. Observations and data reduction
2.1. XMM-Newton
XMM-Newton observed EXO 1745−248 for 80.8 ks starting on 2015 March 22 at 04:52 (UTC; ObsId 0744170201). Data were reduced using the SAS (Science Analysis Software) v.14.0.0.
The EPIC-pn camera observed the source in timing mode to achieve a high temporal resolution of 29.5 μs and to limit the effects of pile-up distortion of the spectral response during observations of relatively bright Galactic X-ray sources. A thin optical blocking filter was used. In timing mode the imaging capabilities along one of the axis are lost to allow a faster readout. The maximum number of counts fell on the RAWX coordinates 36 and 37. To extract the source photons, we then considered a 21-pixel-wide strip extending from RAWX = 26 to 46. Background photons were instead extracted in the region ranging from RAWX = 2 to RAWX = 6. Single and double events were retained. Seven type I X-ray bursts took place during the XMM-Newton observation with a typical rise time of less than 5 s and a decay e-folding timescale ranging from 10 to 23 s. In order to analyze the persistent (i.e., non-bursting) emission of EXO 1745−248, we identified the start time of each burst as the first 1 s long bin that exceeded the average countrate by more than 100 s-1, and removed from the analysis a time interval spanning from 15 s before and 200 s after the burst onset. After the removal of the burst emission, the mean count rate observed by the EPIC-pn was 98.1 s-1. Pileup was not expected to significantly affect the spectral response of the EPIC-pn at the observed persistent count rate (Guainazzi et al. 2014; Smith et al. 2016)2. To check the absence of strong distortion, we ran the SAS task epatplot and obtained that the fraction of single- and double-pattern events falling in the 2.4−10 keV band were compatible with the expected value within the uncertainties. Therefore, no pileup correction method was employed. The spectrum was rebinned to have no more than three bins per spectral resolution element and at least 25 counts per channel.
The MOS-1 and MOS-2 cameras were operated in Large Window and Timing mode, respectively. At the count rate observed from EXO 1745−248, both cameras suffered from pileup at a fraction exceeding 10% and were therefore discarded for further analysis.
We also considered data observed by the Reflection Grating Spectrometer (RGS), which operated in Standard Spectroscopy mode. We considered photons falling in the first order of diffraction. The same time filters as for the EPIC-pn data analysis were applied.
2.2. INTEGRAL
We analyzed all INTEGRAL (Winkler et al. 2003) available data collected in the direction of EXO 1745−248 during the source outburst in 2015. These observations included both publicly available data and our proprietary data in AO12 cycle.
The reduction of the INTEGRAL data was performed using the standard Offline Science Analysis (OSA) version 10.2 distributed by the ISDC (Courvoisier et al. 2003). INTEGRAL data are divided into science windows (SCW), that is, different pointings lasting each ~ 2−3 ks. We analyzed data from the IBIS/ISGRI (Ubertini et al. 2003; Lebrun et al. 2003), covering the energy range 20−300 keV energy band, and from the two JEM-X monitors (Lund et al. 2003), operating in the range 3−20 keV. As the source position varied with respect to the aim point of the satellite during the observational period ranging from 2015 March 12 at 19:07 (satellite revolution 1517) to 2015 April 28 at 11:40 UTC (satellite revolution 1535), the coverage provided by IBIS/ISGRI was generally much larger than that of the two JEM-X monitors because their field of view is smaller.
As the source was relatively bright during the outburst, we extracted a light curve with a resolution of 1 SCW for both IBIS/ISGRI and the two JEM-X units. This is shown in Fig. 1, together with the monitoring observations provided by Swift/XRT (0.5−10 keV). The latter data were retrieved from the Leicester University on line analysis tool (Evans et al. 2009) and used only to compare the monitoring provided by the Swift and INTEGRAL satellites. We refer to Tetarenko et al. (2016) for more details on the Swift data and the corresponding analysis. In agreement with the results discussed by these authors, the INTEGRAL data also show that the source underwent a hard-to-soft spectral state transition around 57 131 MJD. In order to prove this spectral state change more quantitatively, we extracted two sets of INTEGRAL spectra accumulating all data before and after this date for ISGRI, JEM-X1, and JEM-X2. The analysis of broadband INTEGRAL spectra for both the hard and soft state is reported in Sect. 3.1.
We also extracted the ISGRI and JEM-X data by using only the observations carried out during satellite revolution 1521, as the latter partly overlapped with the time of the XMM-Newton observation. The broadband fit of the combined quasi-simultaneous XMM-Newton and INTEGRAL spectrum of the source is discussed in Sect. 3.2.
We removed from the data used to extract all JEM-X and ISGRI spectra mentioned above the SCWs corresponding to the thermonuclear bursts detected by INTEGRAL. These were searched for by using the JEM-X light curves collected with 2 s resolution in the 3−20 keV energy band. A total of four bursts were clearly detected by JEM-X in SCW 76 of revolution 1517 and in SCWs 78, 84, 94 of revolution 1521. The onset times of these bursts were 57 094.24535 MJD, 57 104.86423 MJD, 57 104.99993 MJD, and 57 105.25787 MJD, respectively. None of these bursts were significantly detected by ISGRI or showed evidence for a photospheric radius expansion. Given the limited statistics of the two JEM-X monitors during the bursts, we did not perform any refined analysis of these events.
 |
Fig. 1 Light curve of the 2015 outburst displayed by EXO 1745−248 as observed by IBIS/ISGRI and JEM-X on board INTEGRAL. For completeness, we also report the light curve obtained from Swift/XRT and published previously by Tetarenko et al. (2016). The hard-to-soft spectral state transition of EXO 1745−248 around 57 131 MJD discussed by Tetarenko et al. (2016) is marked with a dashed vertical line in the plots (around this date, the countrate of the source in the IBIS/ISGRI decreases significantly, while it continues to increase in JEM-X). |
 |
Fig. 2 Broadband spectrum of EXO 1745−248 as observed by INTEGRAL in the hard (top) and soft (bottom) state (ISGRI data are in black, JEM-X1 data in red, and JEM-X2 data in green). For both states the best fit to the spectrum was obtained with an absorbed cutoff power-law model (see text for details). The residuals from the best fits are shown in the bottom panels of the upper and lower figure. |
3. Spectral analysis
Spectral analysis has been performed using XSPEC v.12.8.1 (Arnaud 1996). Interstellar absorption was described by the TBAbs component. For each fit we used element abundances from Wilms et al. (2000). The uncertainties on the parameters quoted in the following are evaluated at a 90% confidence level.
3.1. Hard and soft INTEGRAL spectra
The broadband INTEGRAL spectrum of the source could be well described by using a simple absorbed power-law model with a cutoff at the higher energies (we fixed in all fits the absorption column density to the value measured by XMM-Newton in Sect. 3.2, i.e., NH = 2.02 × 1022cm-2). In the hard state ( ), we measured a power-law photon index Γ = 1.1 ± 0.1 and a cutoff energy of 23 ± 2 keV. The source X-ray flux was (2.9 ± 0.2) × 10-9 erg cm-2 s-1 in the 3−20 keV energy band, (1.0 ± 0.1) × 10-9 erg cm-2 s-1 in the 20−40 keV energy band, and (6.1 ± 0.3) × 10-10 erg cm-2 s-1 in the 40−100 keV energy band. The effective exposure time was of 123 ks for ISGRI and 75 ks for the two JEM-X units. In the soft state (
 ), we measured a power-law photon index Γ = 0.6 ± 0.2 and a cutoff energy of 3.8 ± 0.5 keV. The source X-ray flux was (9.5 ± 0.5) × 10-9 erg cm-2 s-1 in the 3−20 keV energy band, (1.6 ± 0.3) × 10-10 erg cm-2 s-1 in the 20−40 keV energy band, and (1.1 ± 0.5) × 10-12 erg cm-2 s-1 in the 40−100 keV energy band. The effective exposure time was of 32 ks for ISGRI and 20 ks for the two JEM-X units. The two broadband spectra and the residuals from the best fits are shown in Fig. 2.
3.2. 2.4–10 keV EPIC-pn spectrum
We first considered the spectrum observed by the EPIC-pn at energies between 2.4 and 10 keV (see top panel of Fig. 3), as a soft-excess probably related to uncertainties in the redistribution calibration affected data taken at lower energies (see the discussion in Guainazzi et al. 20153, and references therein). Interstellar absorption was described by the TBAbs component (Wilms et al. 2000), the photoelectric cross sections from Verner et al. (1996) with the hydrogen column density fixed to NH = 2 × 1022 cm-2, as indicated by the analysis performed with the inclusion of RGS low-energy data (see Sect. 3.3). The spectral continuum was dominated by a hard power-law-like component with spectral index Γ ≃ 2, which we modeled as thermal Comptonization of soft photons with kTin ≃ 1.3 keV using the model nthcomp (Zdziarski et al. 1996; Życki et al. 1999). As the electron temperature fell beyond the energy range covered by the EPIC-pn, we fixed this parameter to 37 keV, as suggested by the analysis of data taken by INTEGRAL at higher energies (see Sect. 3.3). We modeled the strong residuals left by the Comptonization model at low energies with a blackbody with effective temperature kTth ≃ 0.6 keV and emission radius Rth ≃ 5.5 d5.5 km, where d5.5 is the distance to the source in units of 5.5 kpc. The addition of this component was highly significant as it decreased the model reduced chi-squared from 47.9 to 26.5 for the two degrees of freedom less, out of 122. The F-test gives a probability of chance improvement of ~1.3 × 10⁻¹⁵ for the addition of the blackbody component. In this case, the use of the F-test is justified by the fact that the model is additive (see Orlandini et al. 2012).
Even after the addition of a thermal component, the quality of the spectral fit was still very poor mainly because of residuals observed at energies of the Fe K-α transition (6.4−7 keV; see middle panel of Fig. 3). The shape of this emission complex is highly structured, and one emission line was not sufficient to provide an acceptable modeling. We then modeled the iron complex using three Gaussian features centered at energies  ,
,  and
and  keV. These energies are compatible with K-α transition of ionized Fe XXV, K-α, and K-β of neutral or weakly ionized Fe (I-XX), respectively. The ionized iron line is relatively broad (σ1 = 0.24 ± 0.03 keV) and strong (equivalent width EW1 = 62.0 ± 0.2 eV), while the others are weaker and have a width lower than the spectral resolution of the instrument. In order to avoid correlation among the fitting parameters, we fixed the normalization of the K-β transition of weakly ionized iron to one tenth of the K-α. The addition of the three Fe emission lines decreased the model χ2 to 266 for 114 degrees of freedom. In this case, for the addition of the iron lines, the F-test probability is ~ 2.7 × 10⁻¹⁶. Three more emission lines were required at lower energies,
  , E5 = 3.30(3), and
  keV, compatible with K-α transitions of S XVI, Ar XVIII, and Ca XX (or XIX), respectively. The significance of these lines was evaluated with an F-test, giving probabilities of 3 × 10⁻⁴, 9 × 10⁻⁶ , and 7.7 × 10⁻⁸, respectively, that the improvement of the fit χ2 obtained after the addition of the line is due to chance. The chi-squared of the model (dubbed Model I in Table 1) is χ2 = 154.5 for 106 degrees of freedom.
Best-fit parameters for the models used to fit the spectrum of EXO 1745–248.
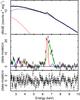 |
Fig. 3 Spectrum observed by the EPIC-pn between 2.4 and 10 keV together with the best-fitting blackbody (red dashed line) and Comptonization (blue dashed line) component of Model II listed in Table 1 (top panel). Residuals obtained when the six emission features at energies E1 = 6.75 keV (green solid line), E2 = 6.48 keV (red solid line), E3 = 7.12 keV (blue solid line), E4 = 2.74 keV (cyan), E5 = 3.30 keV (magenta), and E6 = 3.94 keV(yellow) are removed from Model II (middle panel). The model is not fitted after the line removal, so the residuals are only plotted for illustrative purposes. Residuals left by Model II are plotted in the bottom panel. |
The broadness of the 6.75 keV Fe XXV line suggests reflection of hard X-rays off the inner parts of the accretion disk as a plausible origin. We then replaced the Gaussian profile with a relativistic broadened diskline profile (Fabian et al. 1989). The three emission lines found between 2.4 and 4 keV have high ionization states and probably originate from the same region. We then modeled them with relativistic broadened emission features as well, keeping the disk emissivity index, βirr, and the geometrical disk parameters (the inner and outer disk radii, Rin and Rout, and inclination, i) tied to the values obtained for the Fe XXV line. As the spectral fit was insensitive to the outer disk radius parameter, we left it frozen to its maximum value allowed (107Rg, where Rg = GM/c2 is the NS gravitational radius). Modeling of the neutral (or weakly ionized) narrow Fe lines at ≃ 6.5 and 7.1 keV with a Gaussian profile was maintained. We found that the energy of the lines were all consistent within the uncertainties with those previously determined with Model I. The parameters of the relativistic lines indicate a disk extending down to  Rg with an inclination of i = (37 ± 2)° and an emissivity index of
  (see column dubbed Model II of Table 1 for the whole list of parameters). Modeling of the spectrum with these broad emission lines decreased the fit χ2 to 141.8, for 106 degrees of freedom, which translates into a probability of pnull = 10-2 of obtaining a value of the fit χ2 as high or higher if the data are drawn from such a spectral model. Figure 3 shows the observed spectrum, the residuals with and without the inclusion of the emission lines. The model parameters are listed in the fourth column of Table 1.
3.3. 0.35–180 keV XMM-Newton/INTEGRAL broadband spectrum
In order to study the broadband spectrum of EXO 1745−248, we simultaneously fit the spectra observed by the two RGS cameras (0.35−2.0 keV) and the EPIC-pn (2.4−10 keV) on board XMM-Newton, together with the spectra observed by the two JEM-X cameras (5−25 keV) and ISGRI (20−180 keV) on board INTEGRAL during the satellite revolution 1521, which partly overlapped with the XMM-Newton pointing. We initially considered Model II, in which the continuum was modeled by the sum of a Comptonized and a thermal component, the lines with energies compatible with ionized species were described by a relativistic broadened disk emission lines, and the K-α and K-β lines of neutral (or weakly) ionized iron were modeled by a Gaussian profile. For the broadband spectrum we decided to fix the energy of the Kβ iron line to its rest-frame energy of 7.06 keV to stabilize the fit better. The inclusion of the RGS spectra at low energies yielded a measure of the equivalent hydrogen column density NH = (2.02 ± 0.04) × 1022 cm-2. At the high-energy end of the spectrum, the ISGRI spectrum constrained the electron temperature of the Comptonizing electron population to  keV. The other parameters describing the continuum and the lines were found to be compatible with those obtained from the modeling of the EPIC-pn spectra alone. The model parameters are listed in the fifth column of Table 1, dubbed Model II*.
In order to entertain the hypothesis that the broad emission lines are due to reflection of the primary Comptonized spectrum onto the inner accretion disk, we replaced the Fe XXV broad emission line described as disklines in Model II* with a self-consistent model describing the reflection off an ionized accretion disk. We convolved the Comptonized component describing the main source of hard photons, nthComp, with the disk reflection model rfxconv (Kolehmainen et al. 2011).
We further convolved the rfxconv component with a relativistic kernel (rdblur) to take into account relativistic distortion of the reflection component due to a rotating disk. Because the rfxconv model does not include Ar and Ca transitions and does not give a good modeling of the S line, leaving clear residuals at ~ 2.7 keV, we included three diskline components for them, linking the parameters of the rdblur component to the corresponding smearing parameters of the disklines, according to the hypothesis that all these lines originate from the same disk region (see, e.g., di Salvo et al. 2009; Egron et al. 2013; Di Salvo et al. 2015). The best fit with this model (dubbed Model III, see sixth column of Table 1) was slightly worse (χ2/d.o.f. = 1271/1083) than for Model II* (χ2/d.o.f. = 1248/1083). According to the reflection model, the solid angle (Ωr/ 2π) subtended by the reflector as seen from the illuminating source was 0.22 ± 0.04. The logarithm of the ionization parameter of the disk was ≃2.7, which could well explain the ionization state of the Fe XXV, S XVI, Ar XVIII, and Ca XX (or XIX) emission lines observed in the spectrum. The inclination angle of the system was found to be consistent with 37°. The broadband continuum and the line parameters were not significantly changed by the introduction of the reflection model. The six instrument spectra, Model III, and the residuals are plotted in Fig. 4. This figure shows a clear trend of residuals between 10 and a 30 keV (consistent with a possible reflection hump), which our reflection models cannot describe well.
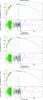 |
Fig. 4 Broadband spectra, models, and residuals in units of σ for Model II*, Model III, and Model IV are plotted in the top, middle, and lower panel, respectively. These are RGS1 (red), RGS2 (green), EPIC-pn (black), JEMX1 (blue), JEMX2 (cyan), and ISGRI (magenta) spectra. |
To independently test the significance of the Compton hump and absorption edges, constituting the continuum of the reflection component, we also tried a different reflection model, namely pexriv (Magdziarz & Zdziarski 1995), which describes an exponential cutoff power-law spectrum reflected from ionized material. We fixed the disk temperature to the default value 106 K and the value on reflection fraction to 0.22, which is the best value found in Model III. We also tied parameters describing the irradiating power-law (photon index and energy cut-off) to those indicated by the nthComp component. As the iron emission is not included in the pexriv model, we added a diskline centered at 6.75 keV. The results of the fit are reported in the seventh column of Table 1, labeled “Model IV”. The parameters describing the irradiating continuum and the reflection component are compatible with those obtained with rfxconv, and the fit χ2 slightly improved with respect to Model III (Δχ2 = 28.6 for two degrees of freedom less), while it is compatible with the results obtained with Model II*.
Since the width of the Gaussian lines describing the Kα and Kβ lines from neutral or mildly ionized iron were always compatible with 0, we fixed the width of these lines to be null in all our fits. This an acceptable assumption because the upper limits calculated for the width of the iron Kα line at 6.5 keV are σ< 0.022 keV and σ< 0.040 keV for Model III and Model IV, respectively.
4. Temporal analysis
The persistent (i.e., non-bursting) emission observed during the XMM-Newton EPIC-pn observation was highly variable, with a sample fractional rms amplitude of 0.33. A portion of the persistent light curve is shown in Fig. 5 for illustrative purposes. To study the power spectrum of the aperiodic variability, we performed a fast Fourier transform of 32-s long intervals of the 0.5−10 keV EPIC-pn time series with 59 μs time resolution (corresponding to a Nyquist maximum frequency of 8468 Hz). We averaged the spectra obtained in the various intervals by rebinning the resulting spectrum as a geometrical series with a ratio of 1.04. The Leahy normalized and white-noise-subtracted average power spectrum is plotted in Fig. 6. The spectrum is dominated by a flicker noise component described by a power law, P(ν) ∝ ν− α, with α = 1.05(1), slightly flattening toward low frequencies. In order to search for kHz quasi-periodic oscillations that have been observed from the source at a frequency ranging from 690 to 715 Hz (Mukherjee & Bhattacharyya 2011; Barret 2012), we produced a power density spectrum over 4 s long intervals to have a frequency resolution of 0.25 Hz, and averaged the extracted spectra every 40 consecutive intervals. No oscillation was found within a 3σ confidence level upper limit of 1.5% on the rms variation.
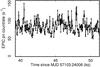 |
Fig. 5 Snapshot of the 0.5−10 keV persistent light curve observed by the EPIC-pn on board XMM-Newton. Counts were binned in 32 s long intervals. |
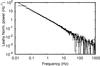 |
Fig. 6 Leahy normalized power-density spectrum evaluated averaging spectra computed over 8 s long intervals of the EPIC-pn observation, and rebinning the resulting spectrum as a geometrical series with ratio equal to 1.04. A white-noise level equal to 1.99(1) has been subtracted. The solid line represents a power law, P(ν) = ν− α with index α = 1.05. |
In order to search for a coherent signal in the light curve obtained by the EPIC-pn, we first reported the observed photons to the solar system barycenter, using the position RA = 17h48m05.236, Dec = − 24°46′47.38′′ reported by Heinke et al. (2006) with an uncertainty of 0.02′′ at 1σ confidence level). We performed a power-density spectrum on the whole tpds = 77.5 ks exposure by re-binning the time series to a resolution equal to eight times the minimum (tres = 2.3 × 10⁻⁴ s, giving a maximum frequency of νNy = 2117 Hz). After taking into account the number of frequencies searched, Nf ≃ νNytpds = 1.64 × 10⁸, we did not find any significant signal with an upper limit at 3σ confidence level of 0.5% on the amplitude of a sinusoidal signal, evaluated following Vaughan et al. (1994).
The orbital period of EXO 1745−248 is currently unknown. Based on the spectral properties, Heinke et al. (2006) suggested it might be hosted in an ultra-compact binary (Porb ≪ 1 d). Based on empirical relation between the V magnitude of the optical counterpart, the X-ray luminosity and the orbital period, Ferraro et al. (2015) estimated a likely range for the orbital period of between 0.1 and 1.3 d. As the orbital period is likely on the same order of the exposure length of the observation considered or shorter, the orbital motion will induce shifts in frequency of a coherent signal that hamper any periodicity search. We then performed a search on shorter time intervals, with a length ranging from 124 to 5500 s. The data acquired during type I X-ray bursts were discarded. No signal was detected at a confidence level of 3σ, with an upper limit ranging between 14% and 2%, with the latter limit relative to the longer integration time.
In order to improve the sensitivity to signals affected by the unknown binary orbital motion, we applied the quadratic coherence recovery technique described by Wood et al. (1991) and Vaughan et al. (1994). We divided the entire light curve into time intervals of length equal to Δt = 495 s. In each of the intervals the times of arrival of X-ray photons tarr were corrected using the relation  ; the parameter α was varied in steps equal to δα = (2νNyΔt2)-1 = 9.6 × 10⁻¹⁰ s-1 to cover a range between αmax = 1.7 × 10⁻⁸ s-1 and αmin = −αmax. The width of the range was determined by a guess on the orbital parameters of the system that would be optimal for an orbital period of 12 h, a donor star mass of M2 = 0.3M⊙, a NS spin period of P = 3 ms, and a donor-to-NS mass ratio of q = 0.2 (see Eq. (14) of Wood et al. 1991). This method confirmed the lack of any significant periodic signal, with an upper limit of 7% on the sinusoidal amplitude. We also considered a shorter time interval of Δ t = 247 s and still obtained no detection within a 3σ c.l. upper limit of 10.5%.
We also searched for burst oscillations in the seven events observed during the XMM-Newton exposure. To this aim, we produced power-density spectra over intervals of variable length, ranging from 2 to 8 s, and a time resolution equal to that used above (tres = 2.3 × 10⁻⁴ s). No significant signal was detected in either of the bursts, with 3σ c.l. upper limit on the signal amplitude of the order of ≃ 20 and ≃ 10% for the shorter and longer integration times used, respectively.
5. Type I X-ray bursts
Seven bursts took place during the XMM-Newton observation, with a recurrence time varying between trec = 2.5 and 4 h (see Table 2). The bursts attained a peak 0.5−10 keV EPIC-pn count rate ranging from 1100 to 1500 counts s-1 (see top panel of Fig. 7 where we plot the light curve of the second burst seen during the XMM-Newton exposure). These values exceed the EPIC-pn telemetry limit (≈450 counts s-1), and data overflows occurred close to the burst maximum. The burst rise takes place in less than ≈ 5 s, while the decay could be approximately modeled with an exponential function with an e-folding timescale ranging between 10 and 23 s. In order to analyze the evolution of the spectral shape during the bursts, we extracted spectra over time intervals of length ranging from 1 to 100 s depending on the count rate. In order to minimize the effect of pileup, which becomes important when the count rate increases above a few hundreds of counts per second, we removed the two brightest columns of the EPIC-pn chip (RAWX = 36−37). Background was extracted considering the persistent emission observed between 600 and 100 s before the burst onset. The resulting spectra were modeled with an absorbed blackbody, fixing the absorption column to the value found in the analysis of the persistent emission (NH = 2 × 1022 cm-2). The evolution of the temperature and apparent radius observed during the second burst, the one with the highest peak flux seen in the XMM-Newton observation, are plotted in the middle and bottom panels of Fig. 7, respectively. The temperature attained a maximum value of ≈ 3.5 keV and then decreased steadily, confirming the thermonuclear nature of the bursts. The estimated apparent extension of the black-body emission remained always much lower than any reasonable value expected for the radius of a standard neutron star (≳8−13 km). The maximum flux attained a value of 3.8(7) × 10-8 erg cm-2 s-1 (see Table 2), which translates into a luminosity of  erg s-1. This value is both lower than the Eddington limit for an NS and cosmic abundance (1.76 × 1038 (M/ 1.4 M⊙) erg s-1) and the luminosity attained during the two bursts characterized by photospheric radius expansion reported by Galloway et al. (2008,
  erg s-1. Similar properties were also observed in the other bursts, and we conclude that no photospheric radius expansion occurred in any of the bursts observed by XMM-Newton. In addition, bursts characterized by photospheric radius expansion often show a distinctive spectral evolution after the rise, characterized by a dip of the blackbody temperature occurring when the radius attains its maximum value, while the flux stays at an approximately constant level (see, e.g., Fig. 2 of Galloway et al. 2008). Although the minimum time resolution of our spectral analysis (1s) is limited by the available photon statistics, no such variability pattern seems to be present in the observed evolution of the burst parameters (see Fig. 7). Combined with the relatively low X-ray luminosity attained at the peak of the bursts, we therefore conclude that it is unlikely that a photospheric radius expansion occurred in any of the bursts observed by XMM-Newton.
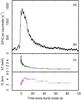 |
Fig. 7 0.5−10 keV light curve of the second burst observed by the EPIC-pn, which began on T2 = 57 103.41516 MJD (top panel). The central and bottom panels show the temperature and apparent radius of the blackbody used to model the time-resolved spectra, respectively. The radius is evaluated for a distance of 5.5 kpc. Errors are reported with a 90% confidence. |
Table 2 lists the energetics of the seven bursts observed by XMM-Newton. The persistent flux was evaluated by fitting the spectrum observed from 500 s after the previous burst onset and 50 s before the actual burst start time, using Model I (see Table 1). We measured the fluence ℱ by summing the fluxes observed in the different intervals over the duration of each burst. We also evaluated the burst timescale as the ratio τ = ℱ /Fpeak (van Paradijs et al. 1988). The rightmost column of Table 2 displays the parameter α, defined as the ratio between the persistent integrated flux and the burst fluence (α = cbolFperstrec/ ℱ; see, e.g., Galloway et al. 2008), where cbol is a bolometric correction factor that we estimated from the ratio between the flux observed in the 0.5−100 keV and the 0.5−10 keV band with Models II* and II, respectively (see Table 1), cbol = 2.8 ± 0.3. We evaluated values of α ranging between 50 and 110, with an average ⟨ α ⟩ = 82.
Properties of the type I X-ray bursts observed by XMM-Newton.
6. Discussion
We analyzed quasi-simultaneous XMM-Newton and INTEGRAL observations of the transient LMXB EXO 1745−248 in the massive globular cluster Terzan 5, carried out when the source was in the hard state, just after it went into outburst in 2015, with the aim to characterize its broadband spectrum and its temporal variability properties. We also made use of all additionally available INTEGRAL data collected during the outburst of the source in 2015 to spectroscopically confirm the hard-to-soft state transition that occurred around 57 131 MJD. This transition was first noted by Tetarenko et al. (2016) using the source light curves extracted from Swift/BAT, Swift/XRT, and MAXI.
6.1. Combined XMM-Newton and INTEGRAL spectrum
We modeled the spectrum observed simultaneously by XMM-Newton and INTEGRAL to study the X-ray emission from the source in the energy range 0.8−100 keV. We estimated an unabsorbed total luminosity (0.5−100 keV energy range) of  erg s-1. The continuum was well described by a two-component model, corrected by the low-energy effects of interstellar absorption. The best-fit value of the equivalent hydrogen column density, NH, is (2.02 ± 0.05) × 1022 cm-2, slightly lower than the estimate of interstellar absorption toward Terzan 5 given by Bahramian et al. (2014), NH = (2.6 ± 0.1) × 1022 cm-2. The two-component continuum model consist of a quite hard Comptonization component, described by the nthComp model, with electron temperature kTe ~ 40 keV, photon index Γ ≃ 1.8−2 and seed-photon temperature of about 1.3 keV, and of a soft thermal component described by a blackbody with temperature kT ~ 0.6−0.7 keV. The Comptonization component contributed to more than 90 per cent of the flux observed during the observations considered, which clearly indicates that the source stayed in the hard state.
Assuming a spherical geometry for both the blackbody and the seed-photon emitting regions and ignoring any correction factor due to color temperature corrections or boundary conditions, we found a radius of the blackbody emitting region of about Rbb = 3.5−5 km and a radius of the seed-photon emitting region of about Rw = 2−3 km. Given these modest extensions, it is likely that the surfaces of seed photons are related to hot spots on the neutron star surface. The latter was calculated using the relation reported by in ’t Zand et al. (1999), assuming an optical depth of the Comptonization region, τ = 2.2 ± 0.3, evaluated using the relation between the optical depth, the temperature of the Comptonizing electrons and the asymptotic power-law index given by Lightman & Zdziarski (1987).
A similar spectral shape was found during the 2000 outburst of EXO 1745−248 observed by Chandra and RXTE (Heinke et al. 2003a). In this case, the continuum model consisted of a multicolor disk blackbody, characterized by an inner temperature of kT = 0.6−1.2 keV and an inner disk radius of rin/d10(cosi)0.5 = 4.3−9.2 km, and a Comptonization component, described by the comptt model, characterized by a seed photon temperature of kT0 = 1.2−1.7 keV and radius Rw = 3.1−6.7 km, an electron temperature of kTe = 9.8−10.7 keV, and an optical depth τ = 8. The Comptonization spectrum was softer during the Chandra/RXTE observations than during the XMM-Newton/INTEGRAL observation analyzed here, and the 0.1−100 keV luminosity was LX ≈ 6.6 × 1037 erg/s, higher by about a factor 6 than during our observation. Such a softening of the Comptonization spectrum with increasing luminosity is in agreement with the results presented by Tetarenko et al. (2016) for the 2015 outburst using Swift/XRT data (see their Table 1) and our findings in Sect. 2.2 by using the INTEGRAL monitoring data.
Thanks to the large effective area and the moderate-to-good energy resolution of the EPIC-pn, we could detect several emission features in the spectrum of EXO 1745−248. Most of the emission features are broad and are identified with Kα transitions of highly ionized elements. These are the 2.6−2.7 keV line identified as S XVI transition (H-like, expected rest frame energy 2.62 keV), the 3.3 keV line identified as Ar XVIII transition (H-like, expected rest-frame energy 3.32 keV), the 3.96−4.1 keV line identified as Ca XIX or Ca XX transition (He or H-like, expected rest-frame energy 3.9 and 4.1 keV, respectively), and the 6.75 keV line identified as Fe XXV (He-like) transition (expected rest-frame energy 6.7 keV). The Gaussian width of the Fe XXV line we observed from EXO 1745−248,  keV, is compatible with the width of the Fe line detected during the 2000 outburst (Heinke et al. 2003a). The widths of the low-energy lines are compatible with being about half the width of the iron line, in agreement with the expectations from Doppler or thermal Compton broadening, for which the width is proportional to the energy. Therefore all these lines are probably produced in the same emitting region, characterized by similar velocity dispersion or temperature (i.e., the accretion disk).
The fitting of the iron line appears, however, much more complex and puzzling than usual. At least two components are needed to fit the iron emission feature because highly significant residuals are still present after a broad Gaussian is included in the model. We fit these residuals using another Gaussian centered at ~ 6.5 keV (therefore to be ascribed to neutral or mildly ionized iron), which appears to be much narrower than the previous component (its width is well below the energy resolution of the instrument and compatible with 0). Driven by a small residual still present at ~ 7 keV and by the expectation that the 6.5-keV Kα transition should be accompanied by a 7.1 keV Kβ transition, we also added to the model a narrow Gaussian centered at ~ 7.1 keV, which we identify with the Kβ transition of neutral or mildly ionized iron. We note that the flux ratio of the Kβ transition to the Kα transition reaches its maximum of 0.15−0.17 for Fe VIII, while it drops to less than 0.1 for charge numbers higher than Fe X-XI (see Palmeri et al. 2003). This suggests that these components originate from low-ionization iron (most probably Fe I-VIII) and come from a different region, plausibly farther from the ionizing central engine than the other broad and ionized emission lines.
Under the hypothesis that the width of the broad lines is due to Doppler and relativistic smearing in the inner accretion disk, we fit these lines in the EPIC-pn spectrum using relativistic broadened disk-lines instead of Gaussian lines (see Models II and II* in Table 1). We obtained a slight improvement of the fit. According to this model, we obtained the emissivity index of the disk, ∝ rβ with β ~ −2.4, the inner radius of the disk, Rin ~ 14−24Rg, and the inclination angle of the system, ~ 37°. Although we have indications that the inclination angle is relatively low (e.g., lack of intrinsic absorption, dip activity, or eclipses), it is worth noting that values of the inclination angle of the system derived from spectral fitting of the reflection component may rely on the assumed geometry of the disk-corona system, and therefore uncertainties on this parameter may be underestimated. Taking advantage of the broadband coverage ensured by the almost simultaneous XMM-Newton and INTEGRAL spectra, we also attempted to use a self-consistent reflection model, which takes into account both the discrete features (emission lines and absorption edges, as well as Compton broadening of all these features) and the Compton-scattered continuum produced by the reflection of the primary Comptonized spectrum off a cold accretion disk (Model III in Table 1). However, we were unable to obtain a statistically significant improvement of the fit with respect to the disk line model. All the parameters were similar to those obtained with the disk line model. The only change in the smearing parameters we obtained using the reflection model instead of disk lines is in the value of the inner disk radius, which is now constrained to be < 8.5Rg. The reflection component required a ionization parameter of log ξ ~ 2.7, consistent with the high ionization degree of the broad lines, and a reflection fraction (that is, the solid angle subtended by the reflector as seen from the corona, Ω/2π) of about 0.22. A non-significant improvement in the description of the spectrum (Δχ2 ≃ −5 for the addition of two parameters) was obtained when using pexriv to model the reflection continuum (Model IV, see Table 1 with respect to best-fit model (Model II*) in Table 1). The observation analyzed here were then not sufficient to ascertain with statistical significance whether a reflection continuum is present in the spectrum.
The smearing parameters of the reflection component were similar to what we find for other sources. The emissivity index of the disk, ~−2.5, the inner radius of the disk, about 30 km or below 13 km, according to the model used for the reflection component, as well as the inclination with respect to the line of sight, 35−40°, are similar to the corresponding values reported in the literature for many other sources (see, e.g., Di Salvo et al. 2015, and references therein). For instance, in the case of atoll LMXB 4U 1705−44, the inner disk radius inferred from the reflection component lay around 14−17Rg both in the soft and in the hard state, changing very little (if any) in the transition from one state to the other (di Salvo et al. 2009; Egron et al. 2013; Di Salvo et al. 2015). In the case of 4U 1728−34, caught by XMM-Newton in a low-luminosity (most probably hard) state, the inner disk radius was constrained to be 14−50Rg (Egron et al. 2011). Even in the case of accreting millisecond pulsars (AMSPs), which are usually found in a hard state and for which we expect that the inner disk is truncated by the magnetic field, inner disk radii in the range 6−40Rg were usually found (see, e.g., Papitto et al. 2009; Cackett et al. 2009; Papitto et al. 2010, 2013a; Pintore et al. 2016; King et al. 2016). Furthermore, the reflection fraction inferred from the rfxconv model, Ω/2π ~ 0.22, although somewhat smaller than what is expected for a geometry with a spherical corona surrounded by the accretion disk (Ω/2π ~ 0.3), is in agreement with typical values for these sources. Values of the reflection fraction below or equal 0.3 were found in a number of cases (e.g., Di Salvo et al. 2015; Degenaar et al. 2015; Pintore et al. 2015, 2016; Ludlam et al. 2016; Chiang et al. 2016). More puzzling is the high ionization parameter required from the broad emission lines, log ξ ~ 2.7−2.8, where ξ = (LX/ (ner2) is the ionization parameter, LX is the bolometric luminosity of the central source, and ne and r are the electron density in the emitting region and the distance of the latter from the central source, respectively. This high value of the ionization parameter is quite usual in the soft state, while in the hard state a lower ionization is usually required, log ξ< 2. This was clearly evident in the hard state of 4U 1705−44 (Di Salvo et al. 2015), although in that case the luminosity was ~ 6 × 1036 ergs/s, about a factor 2 below the observed luminosity of EXO 1745−248 during the observations analysed here.
Perhaps the most unusual feature of this source is the simultaneous presence in its spectrum of a broad ionized iron line and at least one narrow, neutral, or mildly ionized iron line, both in emission and clearly produced in different regions of the system. In highly inclined sources, broad iron emission lines were sometimes found together with highly ionized iron lines in absorption, clearly indicating the presence of an outflowing disk wind (see, e.g., the case of the bright atoll source GX 13+1; Pintore et al. 2014, and references therein). In the case of 4U 1636−536, Pandel et al. (2008) tentatively fit the very broad emission feature present in the range 4−9 keV with a combination of several Kα lines from iron in different ionization states. In particular, they fit the iron complex with two broad emission lines with centroid energies fixed at 6.4 and 7 keV, respectively. However, to our knowledge, there is no other source with a line complex modeled by one broad and one (or two) narrow emission features, as the one showed by EXO 1745−248. While a natural explanation for the broad ionized component is reflection in the inner rings of the accretion disk, the narrow features probably originate from illumination of an outer region in which the motion of the emitting material is much slower, as well as the corresponding ionization parameter. Future observation with instruments with a higher spectral resolution will be needed to finely deconvolve the line shape and firmly assess the origin of each component.
6.2. Temporal variability
The high effective area of the EPIC-pn on board XMM-Newton, combined with its μs temporal resolution, make it the best instrument currently flying to detect coherent X-ray pulsations, in particular those with a period of a few milliseconds that are expected from the weak magnetic field NS in LMXBs. We performed a thorough search for periodicity in the EPIC-pn time series observed from EXO 1745−248, but found no significant signal. The upper limits on the pulse amplitude obtained range from 2 to 15% depending on the length of the intervals considered, the choice of which is a function of the unknown orbital period, and depending on which techniques are applied to minimize the decrease of sensitivity to pulsations that are due to the orbital motion. These upper limits are on the order of and sometimes lower than the amplitudes typically observed from AMSPs (see, e.g., Patruno & Watts 2012). Although it does not exclude the possibility of low-amplitude pulsations, the non-detection of a signal does not favor the possibility that EXO 1745−248 hosts an observable accreting millisecond pulsar (AMSP). This is also indicated by the significantly higher peak luminosity that is reached by EXO 1745−248 during its outbursts (~ 7 × 1037 erg s-1) with respect to AMSPs (≈ few × 1036 erg s-1). Together with the long outburst usually shown (t ~ 100 d), such a high X-ray luminosity suggests that the long-term accretion rate of EXO 1745−248 is more than ten times higher than in AMSPs. A higher mass accretion rate is thought to screen the NS magnetic field (Cumming et al. 2001), which might explain why ms pulsations are observed only in relatively faint transient LMXBs.
At the time of writing, the orbital parameters of EXO 1745−248 are unknown. In agreement with Galloway et al. (2008) and Tetarenko et al. (2016), we have reported a relatively long timescale of the X-ray burst decay, which indicates the presence of hydrogen and hence provides evidence against an ultra-compact nature of this system. Recently, Ferraro et al. (2015) showed that the location of the optical counterpart of EXO 1745−248 in the color-magnitude diagram of Terzan 5 is close to the cluster turnoff and is compatible with a 0.9 M⊙ subgiant branch star if it belongs to the low-metallicity population of Terzan 5. In this case, the mass transfer would have started only recently. The orbital period would be ~ 0.9 days and the optimal integration time to perform a search for periodicity ~ 920 (Ps/ 3 ms)1/2 s, where Ps is the spin period of the putative pulsar (when not performing an acceleration search; see Eq. (21) in Johnston & Kulkarni 1991, evaluated for a sinusoidal signal and an inclination of 37°). The upper limit on the signal amplitude we obtained by performing a signal search on time intervals of this length is 5%.
A useful comparison can be made considering the only accreting pulsar known in Terzan 5, IGR J17480−2446, an NS spinning at a period of 90 ms, hosted in a binary system with an orbital period of 21.3 h (Papitto et al. 2011). Its optical counterpart in quiescence also lies close to the cluster turnoff (Testa et al. 2012). The relatively long spin period of this pulsar and its relatively strong magnetic field compared to AMSP let Patruno et al. (2012) to argue that the source started to accrete and spin up less than a few 107 yr ago and was therefore caught in the initial phase of the mass transfer process that might accelerate it to a spin period of a few milliseconds. When IGR J17480-2446 was found in a hard state, X-ray pulsations were observed at an amplitude of 27 per cent, decreasing to a few per cent after the source spectrum became softer and a cutoff at a few keV (Papitto et al. 2012). The upper limit on pulsations obtained assuming for EXO 1745−248 similar parameters as for IGR J17480−244 is 2%, on the order of the amplitude of the weaker pulsations observed from IGR J17480–244.
On the other hand, if the companion star belongs to the metal-rich population of Terzan 5, it would be located in the color-magnitude diagram at a position where companions to redback millisecond pulsars are found (Ferraro et al. 2015). In this case, a spin period of a few milliseconds would be expected for the NS, and upper limits ranging from 5 to 15% on the pulse amplitude would be deduced from the analysis presented here, depending on the orbital period. For comparison, the redback transitional ms pulsar IGR J18245−2452 in the globular cluster M28 showed pulsations with an amplitude as high as 18% that were easily detected in an XMM-Newton observation of similar length as the one presented here (Papitto et al. 2013b; Ferrigno et al. 2014). This further suggests that EXO 1745−248 is probably not an observable accreting pulsar, unless its pulsations are weaker than those of similar systems and/or it belongs to a very compact binary system. A search for burst oscillations yielded no detection, with an upper limit of ≈ 10% on the pulse amplitude, and therefore the spin period of the NS in EXO 1745−248 remains undetermined.
6.3. Type I X-ray bursts
Seven type I X-ray bursts were observed during the 80 ks XMM-Newton observation presented here, with a recurrence time varying from 2.5 to 4 h. None of the bursts showed a photospheric radius expansion, and all the bursts observed had a relatively long rise time (~ 2−5 s) and decay timescale (τ = 15−23 s, except for the second burst that is the brightest, which had τ ≃ 10 s). Bursts of pure helium are characterized by shorter timescales (τ< 10 s), and we deduce that a fraction of hydrogen was probably present in the fuel of the bursts we observed. More information on the fuel composition can be drawn from the ratio between the integrated persistent flux and the burst fluence, α. This parameter is related to the ratio between the efficiency of energy conversion through accretion onto a compact object (GM∗/R∗) and thermonuclear burning ( MeV nucleon-1, where ⟨ X ⟩ is the abundance of hydrogen burnt in the burst), α = 44(Qnuc/ 4.4 MeV nucleon
 for a 1.4 M⊙ NS with a radius of 10 km (see Eq. (6) of Galloway et al. 2008, and references therein). The observed values of α range from 50 to 100, with an average of 82, indicating that the hydrogen fraction in the bursts was ⟨ X ⟩ ≈ 0.2. The mass accretion rate should then have been high enough to allow stable hydrogen burning between bursts, but part of the accreted hydrogen was left unburnt at the burst onset and contributed to produce an event that lasted longer than pure helium bursts. Combined hydrogen-helium flashes are expected to occur for mass accretion rates higher than ≃ 0.1 ṁEdd (for solar metallicity, lower values are expected for low metallicity, Woosley et al. 2004), where ṁEdd is the Eddington accretion rate per unit area on the NS surface (8.8 × 10⁴ g cm-2 s, or 1.3 × 10⁻⁸M⊙ yr-1 averaged over the surface of an NS with a radius of 10 km). The persistent broadband X-ray luminosity of EXO 1745−248 during the observations considered here indicates a mass accretion rate of
 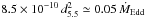 M⊙ yr-1 for a 1.4 M⊙ NS with a 10 km radius, which is lower than the above threshold at which hydrogen would not be exhausted before the burst onset. A low metallicity could help decrease the steady hydrogen burning rate and leave a small fraction of hydrogen in the burst fuel.
The seven bursts observed during the XMM-Newton observation analyzed here share some of the properties of the 21 bursts observed by RXTE during the 2000 outburst before the outburst peak, such as the decay timescale, τ ≈ 25 s, and the peak and persistent flux Fpeak = (3−19) × 10-9 erg cm-2 s-1, Fpers = (1−5) × 10-9 erg cm-2 s-1 and the absence of photospheric radius expansion (see Table 10 and Appendix A31 in Galloway et al. 2008). However, these bursts showed recurrence times of between 17 and 49 min and corresponding lower values of α = 20−46 with respect to those observed here. The observation of frequent long bursts and infrequent short bursts at similar X-ray luminosity made Galloway et al. (2008) classify EXO 1745−248 as an anomalous burster. The observations presented here confirm this puzzling behavior for EXO 1745−248. We note that four additional type I bursts were detected by INTEGRAL during the monitoring observations of EXO 1745−248. As discussed in Sect. 2.2, we did not perform a spectroscopic analysis of these events because of the limited statistics of the two JEM-X units and the lack of any interesting detection in ISGRI that could have indicated the presence of a photospheric radius expansion phase.
Throughout this paper we evaluate luminosities and radii for a distance of 5.5 kpc, which was estimated by Ortolani et al. (2007) with an uncertainty of 0.9 kpc. There is also a determination from Valenti et al. (2007) for the distance (5.9 kpc) that is consistent within errors with Ortolani’s distance.
Acknowledgments
Based on observations obtained with XMM-Newton, an ESA science mission with instruments and contributions directly funded by ESA Member States and NASA, and with INTEGRAL, an ESA project with instruments and science data centre funded by ESA member states, and Poland, and with the participation of Russia and the USA. A.P. acknowledges support via an EU Marie Sklodowska-Curie Individual Fellowship under contract No. 660657-TMSP-H2020-MSCA-IF-2014, as well as fruitful discussion with the international team on “The disk-magnetosphere interaction around transitional millisecond pulsars” at the International Space Science Institute, Bern. We also acknowledge financial support from INAF ASI contract I/037/12/0.
References
- Alpar, M. A., Cheng, A. F., Ruderman, M. A., & Shaham, J. 1982, Nature, 300, 728 [NASA ADS] [CrossRef] [Google Scholar]
- Altamirano, D., Keek, L., Cumming, A., et al. 2012, MNRAS, 426, 927 [NASA ADS] [CrossRef] [Google Scholar]
- Altamirano, D., Krimm, H. A., Patruno, A., et al. 2015, ATel, 7240, 1 [NASA ADS] [Google Scholar]
- Archibald, A. M., Stairs, I. H., Ransom, S. M., et al. 2009, Science, 324, 1411 [NASA ADS] [CrossRef] [PubMed] [Google Scholar]
- Arnaud, K. A. 1996, in Astronomical Data Analysis Software and Systems V, eds. G. H. Jacoby, & J. Barnes, ASP Conf. Ser., 101, 17 [Google Scholar]
- Bahramian, A., Heinke, C. O., Sivakoff, G. R., & Gladstone, J. C. 2013, ApJ, 766, 136 [NASA ADS] [CrossRef] [Google Scholar]
- Bahramian, A., Heinke, C. O., Sivakoff, G. R., et al. 2014, ApJ, 780, 127 [NASA ADS] [CrossRef] [Google Scholar]
- Barret, D. 2012, ApJ, 753, 84 [NASA ADS] [CrossRef] [Google Scholar]
- Bassa, C. G., Patruno, A., Hessels, J. W. T., et al. 2014, MNRAS, 441, 1825 [Google Scholar]
- Cackett, E. M., Altamirano, D., Patruno, A., et al. 2009, ApJ, 694, L21 [NASA ADS] [CrossRef] [Google Scholar]
- Chiang, C.-Y., Cackett, E. M., Miller, J. M., et al. 2016, ApJ, 821, 105 [NASA ADS] [CrossRef] [Google Scholar]
- Courvoisier, T. J.-L., Walter, R., Beckmann, V., et al. 2003, A&A, 411, L53 [NASA ADS] [CrossRef] [EDP Sciences] [Google Scholar]
- Cumming, A., Zweibel, E., & Bildsten, L. 2001, ApJ, 557, 958 [NASA ADS] [CrossRef] [Google Scholar]
- Degenaar, N., & Wijnands, R. 2012, MNRAS, 422, 581 [NASA ADS] [CrossRef] [Google Scholar]
- Degenaar, N., Miller, J. M., Chakrabarty, D., et al. 2015, MNRAS, 451, L85 [NASA ADS] [CrossRef] [Google Scholar]
- di Salvo, T., D’Aí, A., Iaria, R., et al. 2009, MNRAS, 398, 2022 [NASA ADS] [CrossRef] [Google Scholar]
- di Salvo, T., Iaria, R., Matranga, M., et al. 2015, MNRAS, 449, 2794 [NASA ADS] [CrossRef] [Google Scholar]
- Egron, E., di Salvo, T., Burderi, L., et al. 2011, A&A, 530, A99 [NASA ADS] [CrossRef] [EDP Sciences] [Google Scholar]
- Egron, E., Di Salvo, T., Motta, S., et al. 2013, A&A, 550, A5 [NASA ADS] [CrossRef] [EDP Sciences] [Google Scholar]
- Evans, P. A., Beardmore, A. P., Page, K. L., et al. 2009, MNRAS, 397, 1177 [NASA ADS] [CrossRef] [Google Scholar]
- Fabian, A. C., Rees, M. J., Stella, L., & White, N. E. 1989, MNRAS, 238, 729 [NASA ADS] [CrossRef] [Google Scholar]
- Ferraro, F. R., Dalessandro, E., Mucciarelli, A., et al. 2009, Nature, 462, 483 [NASA ADS] [CrossRef] [PubMed] [Google Scholar]
- Ferraro, F. R., Pallanca, C., Lanzoni, B., et al. 2015, ApJ, 807, L1 [NASA ADS] [CrossRef] [Google Scholar]
- Ferraro, F. R., Massari, D., Dalessandro, E., et al. 2016, ApJ, 828, 75 [NASA ADS] [CrossRef] [Google Scholar]
- Ferrigno, C., Bozzo, E., Papitto, A., et al. 2014, A&A, 567, A77 [NASA ADS] [CrossRef] [EDP Sciences] [Google Scholar]
- Galloway, D. K., Muno, M. P., Hartman, J. M., Psaltis, D., & Chakrabarty, D. 2008, ApJS, 179, 360 [NASA ADS] [CrossRef] [Google Scholar]
- Heinke, C. O., Edmonds, P. D., Grindlay, J. E., et al. 2003a, ApJ, 590, 809 [NASA ADS] [CrossRef] [Google Scholar]
- Heinke, C. O., Grindlay, J. E., Lugger, P. M., et al. 2003b, ApJ, 598, 501 [NASA ADS] [CrossRef] [Google Scholar]
- Heinke, C. O., Wijnands, R., Cohn, H. N., et al. 2006, ApJ, 651, 1098 [NASA ADS] [CrossRef] [Google Scholar]
- Hessels, J. W. T., Ransom, S. M., Stairs, I. H., et al. 2006, Science, 311, 1901 [NASA ADS] [CrossRef] [PubMed] [Google Scholar]
- in ’tZand, J. J. M., Verbunt, F., Strohmayer, T. E., et al. 1999, A&A, 345, 100 [NASA ADS] [Google Scholar]
- Johnston, H. M., & Kulkarni, S. R. 1991, ApJ, 368, 504 [NASA ADS] [CrossRef] [Google Scholar]
- King, A. L., Tomsick, J. A., Miller, J. M., et al. 2016, ApJ, 819, L29 [NASA ADS] [CrossRef] [Google Scholar]
- Kolehmainen, M., Done, C., & Díaz Trigo, M. 2011, MNRAS, 416, 311 [NASA ADS] [Google Scholar]
- Kuulkers, E., den Hartog, P. R., in’t Zand, J. J. M., et al. 2003, A&A, 399, 663 [NASA ADS] [CrossRef] [EDP Sciences] [Google Scholar]
- Lebrun, F., Leray, J. P., Lavocat, P., et al. 2003, A&A, 411, L141 [NASA ADS] [CrossRef] [EDP Sciences] [Google Scholar]
- Lightman, A. P., & Zdziarski, A. A. 1987, ApJ, 319, 643 [NASA ADS] [CrossRef] [Google Scholar]
- Linares, M., Chakrabarty, D., Marshall, H., et al. 2015, ATel, 7247, 1 [NASA ADS] [Google Scholar]
- Ludlam, R. M., Miller, J. M., Cackett, E. M., et al. 2016, ApJ, 824, 37 [NASA ADS] [CrossRef] [Google Scholar]
- Lund, N., Budtz-Jørgensen, C., Westergaard, N. J., et al. 2003, A&A, 411, L231 [NASA ADS] [CrossRef] [EDP Sciences] [Google Scholar]
- Magdziarz, P., & Zdziarski, A. A. 1995, MNRAS, 273, 837 [NASA ADS] [CrossRef] [Google Scholar]
- Makishima, K., Ohashi, T., Inoue, H., et al. 1981, ApJ, 247, L23 [NASA ADS] [CrossRef] [Google Scholar]
- Markwardt, C. B., & Swank, J. H. 2000, A&ARv, 7454 [Google Scholar]
- Meylan, G., & Heggie, D. C. 1997, A&ARv, 8, 1 [NASA ADS] [CrossRef] [Google Scholar]
- Motta, S., D’Aı, A., Papitto, A., et al. 2011, MNRAS, 414, 1508 [NASA ADS] [CrossRef] [Google Scholar]
- Mukherjee, A., & Bhattacharyya, S. 2011, ApJ, 730, L32 [NASA ADS] [CrossRef] [Google Scholar]
- Origlia, L., Massari, D., Rich, R. M., et al. 2013, ApJ, 779, L5 [NASA ADS] [CrossRef] [Google Scholar]
- Orlandini, M., Frontera, F., Masetti, N., Sguera, V., & Sidoli, L. 2012, ApJ, 748, 86 [NASA ADS] [CrossRef] [Google Scholar]
- Ortolani, S., Barbuy, B., Bica, E., Zoccali, M., & Renzini, A. 2007, A&A, 470, 1043 [NASA ADS] [CrossRef] [EDP Sciences] [Google Scholar]
- Özel, F., Güver, T., & Psaltis, D. 2009, ApJ, 693, 1775 [NASA ADS] [CrossRef] [Google Scholar]
- Palmeri, P., Mendoza, C., Kallman, T. R., Bautista, M. A., & Meléndez, M. 2003, A&A, 410, 359 [NASA ADS] [CrossRef] [EDP Sciences] [Google Scholar]
- Pandel, D., Kaaret, P., & Corbel, S. 2008, ApJ, 688, 1288 [NASA ADS] [CrossRef] [Google Scholar]
- Papitto, A., Di Salvo, T., D’Aì, A., et al. 2009, A&A, 493, L39 [NASA ADS] [CrossRef] [EDP Sciences] [Google Scholar]
- Papitto, A., Riggio, A., di Salvo, T., et al. 2010, MNRAS, 407, 2575 [NASA ADS] [CrossRef] [Google Scholar]
- Papitto, A., D’Aì, A., Motta, S., et al. 2011, A&A, 526, L3 [Google Scholar]
- Papitto, A., Di Salvo, T., Burderi, L., et al. 2012, MNRAS, 423, 1178 [NASA ADS] [CrossRef] [Google Scholar]
- Papitto, A., D’Aì, A., Di Salvo, T., et al. 2013a, MNRAS, 429, 3411 [NASA ADS] [CrossRef] [Google Scholar]
- Papitto, A., Ferrigno, C., Bozzo, E., et al. 2013b, Nature, 501, 517 [NASA ADS] [CrossRef] [PubMed] [Google Scholar]
- Patruno, A., & Watts, A. L. 2012, ArXiv e-prints [arXiv:1206.2727] [Google Scholar]
- Patruno, A., Alpar, M. A., van der Klis, M., & van den Heuvel, E. P. J. 2012, ApJ, 752, 33 [NASA ADS] [CrossRef] [Google Scholar]
- Pintore, F., Sanna, A., Di Salvo, T., et al. 2014, MNRAS, 445, 3745 [NASA ADS] [CrossRef] [Google Scholar]
- Pintore, F., Di Salvo, T., Bozzo, E., et al. 2015, MNRAS, 450, 2016 [NASA ADS] [CrossRef] [Google Scholar]
- Pintore, F., Sanna, A., Di Salvo, T., et al. 2016, MNRAS, 457, 2988 [NASA ADS] [CrossRef] [Google Scholar]
- Ransom, S. M., Hessels, J. W. T., Stairs, I. H., et al. 2005, Science, 307, 892 [NASA ADS] [CrossRef] [PubMed] [Google Scholar]
- Serino, M., Mihara, T., Matsuoka, M., et al. 2012, PASJ, 64, 91 [NASA ADS] [Google Scholar]
- Testa, V., di Salvo, T., D’Antona, F., et al. 2012, A&A, 547, A28 [NASA ADS] [CrossRef] [EDP Sciences] [Google Scholar]
- Tetarenko, A. J., Bahramian, A., Sivakoff, G. R., et al. 2016, MNRAS, 460, 345 [NASA ADS] [CrossRef] [Google Scholar]
- Tremou, E., Sivakoff, G., Bahramian, A., et al. 2015, ATel, 7262, 1 [NASA ADS] [Google Scholar]
- Ubertini, P., Lebrun, F., Di Cocco, G., et al. 2003, A&A, 411, L131 [NASA ADS] [CrossRef] [EDP Sciences] [Google Scholar]
- Valenti, E., Ferraro, F. R., & Origlia, L. 2007, AJ, 133, 1287 [NASA ADS] [CrossRef] [Google Scholar]
- van Paradijs, J., Penninx, W., & Lewin, W. H. G. 1988, MNRAS, 233, 437 [Google Scholar]
- Vaughan, B. A., van der Klis, M., Wood, K. S., et al. 1994, ApJ, 435, 362 [NASA ADS] [CrossRef] [Google Scholar]
- Verbunt, F., & Hut, P. 1987, in The Origin and Evolution of Neutron Stars, eds. D. J. Helfand, & J.-H. Huang, IAU Symp., 125, 187 [Google Scholar]
- Verbunt, F., Bunk, W., Hasinger, G., & Johnston, H. M. 1995, A&A, 300, 732 [NASA ADS] [Google Scholar]
- Verner, D. A., Ferland, G. J., Korista, K. T., & Yakovlev, D. G. 1996, ApJ, 465, 487 [NASA ADS] [CrossRef] [Google Scholar]
- Warwick, R. S., Norton, A. J., Turner, M. J. L., Watson, M. G., & Willingale, R. 1988, MNRAS, 232, 551 [NASA ADS] [CrossRef] [Google Scholar]
- Wijnands, R., & van der Klis, M. 1998, Nature, 394, 344 [NASA ADS] [CrossRef] [Google Scholar]
- Wilms, J., Allen, A., & McCray, R. 2000, ApJ, 542, 914 [NASA ADS] [CrossRef] [Google Scholar]
- Winkler, C., Courvoisier, T. J.-L., Di Cocco, G., et al. 2003, A&A, 411, L1 [NASA ADS] [CrossRef] [EDP Sciences] [Google Scholar]
- Wood, K. S., Norris, J. P., Hertz, P., et al. 1991, ApJ, 379, 295 [NASA ADS] [CrossRef] [Google Scholar]
- Woosley, S. E., Heger, A., Cumming, A., et al. 2004, ApJS, 151, 75 [NASA ADS] [CrossRef] [Google Scholar]
- Yan, Z., Lin, J., Yu, W., Zhang, W., & Zhang, H. 2015, ATel, 7430 [Google Scholar]
- Zdziarski, A. A., Johnson, W. N., & Magdziarz, P. 1996, MNRAS, 283, 193 [NASA ADS] [CrossRef] [Google Scholar]
- Życki, P. T., Done, C., & Smith, D. A. 1999, MNRAS, 309, 561 [NASA ADS] [CrossRef] [Google Scholar]
All Tables
All Figures
|
Fig. 1 Light curve of the 2015 outburst displayed by EXO 1745−248 as observed by IBIS/ISGRI and JEM-X on board INTEGRAL. For completeness, we also report the light curve obtained from Swift/XRT and published previously by Tetarenko et al. (2016). The hard-to-soft spectral state transition of EXO 1745−248 around 57 131 MJD discussed by Tetarenko et al. (2016) is marked with a dashed vertical line in the plots (around this date, the countrate of the source in the IBIS/ISGRI decreases significantly, while it continues to increase in JEM-X). |
| In the text | |
|
Fig. 2 Broadband spectrum of EXO 1745−248 as observed by INTEGRAL in the hard (top) and soft (bottom) state (ISGRI data are in black, JEM-X1 data in red, and JEM-X2 data in green). For both states the best fit to the spectrum was obtained with an absorbed cutoff power-law model (see text for details). The residuals from the best fits are shown in the bottom panels of the upper and lower figure. |
| In the text | |
|
Fig. 3 Spectrum observed by the EPIC-pn between 2.4 and 10 keV together with the best-fitting blackbody (red dashed line) and Comptonization (blue dashed line) component of Model II listed in Table 1 (top panel). Residuals obtained when the six emission features at energies E1 = 6.75 keV (green solid line), E2 = 6.48 keV (red solid line), E3 = 7.12 keV (blue solid line), E4 = 2.74 keV (cyan), E5 = 3.30 keV (magenta), and E6 = 3.94 keV(yellow) are removed from Model II (middle panel). The model is not fitted after the line removal, so the residuals are only plotted for illustrative purposes. Residuals left by Model II are plotted in the bottom panel. |
| In the text | |
|
Fig. 4 Broadband spectra, models, and residuals in units of σ for Model II*, Model III, and Model IV are plotted in the top, middle, and lower panel, respectively. These are RGS1 (red), RGS2 (green), EPIC-pn (black), JEMX1 (blue), JEMX2 (cyan), and ISGRI (magenta) spectra. |
| In the text | |
|
Fig. 5 Snapshot of the 0.5−10 keV persistent light curve observed by the EPIC-pn on board XMM-Newton. Counts were binned in 32 s long intervals. |
| In the text | |
|
Fig. 6 Leahy normalized power-density spectrum evaluated averaging spectra computed over 8 s long intervals of the EPIC-pn observation, and rebinning the resulting spectrum as a geometrical series with ratio equal to 1.04. A white-noise level equal to 1.99(1) has been subtracted. The solid line represents a power law, P(ν) = ν− α with index α = 1.05. |
| In the text | |
|
Fig. 7 0.5−10 keV light curve of the second burst observed by the EPIC-pn, which began on T2 = 57 103.41516 MJD (top panel). The central and bottom panels show the temperature and apparent radius of the blackbody used to model the time-resolved spectra, respectively. The radius is evaluated for a distance of 5.5 kpc. Errors are reported with a 90% confidence. |
| In the text | |
Current usage metrics show cumulative count of Article Views (full-text article views including HTML views, PDF and ePub downloads, according to the available data) and Abstracts Views on Vision4Press platform.
Data correspond to usage on the plateform after 2015. The current usage metrics is available 48-96 hours after online publication and is updated daily on week days.
Initial download of the metrics may take a while.