Fig. 3
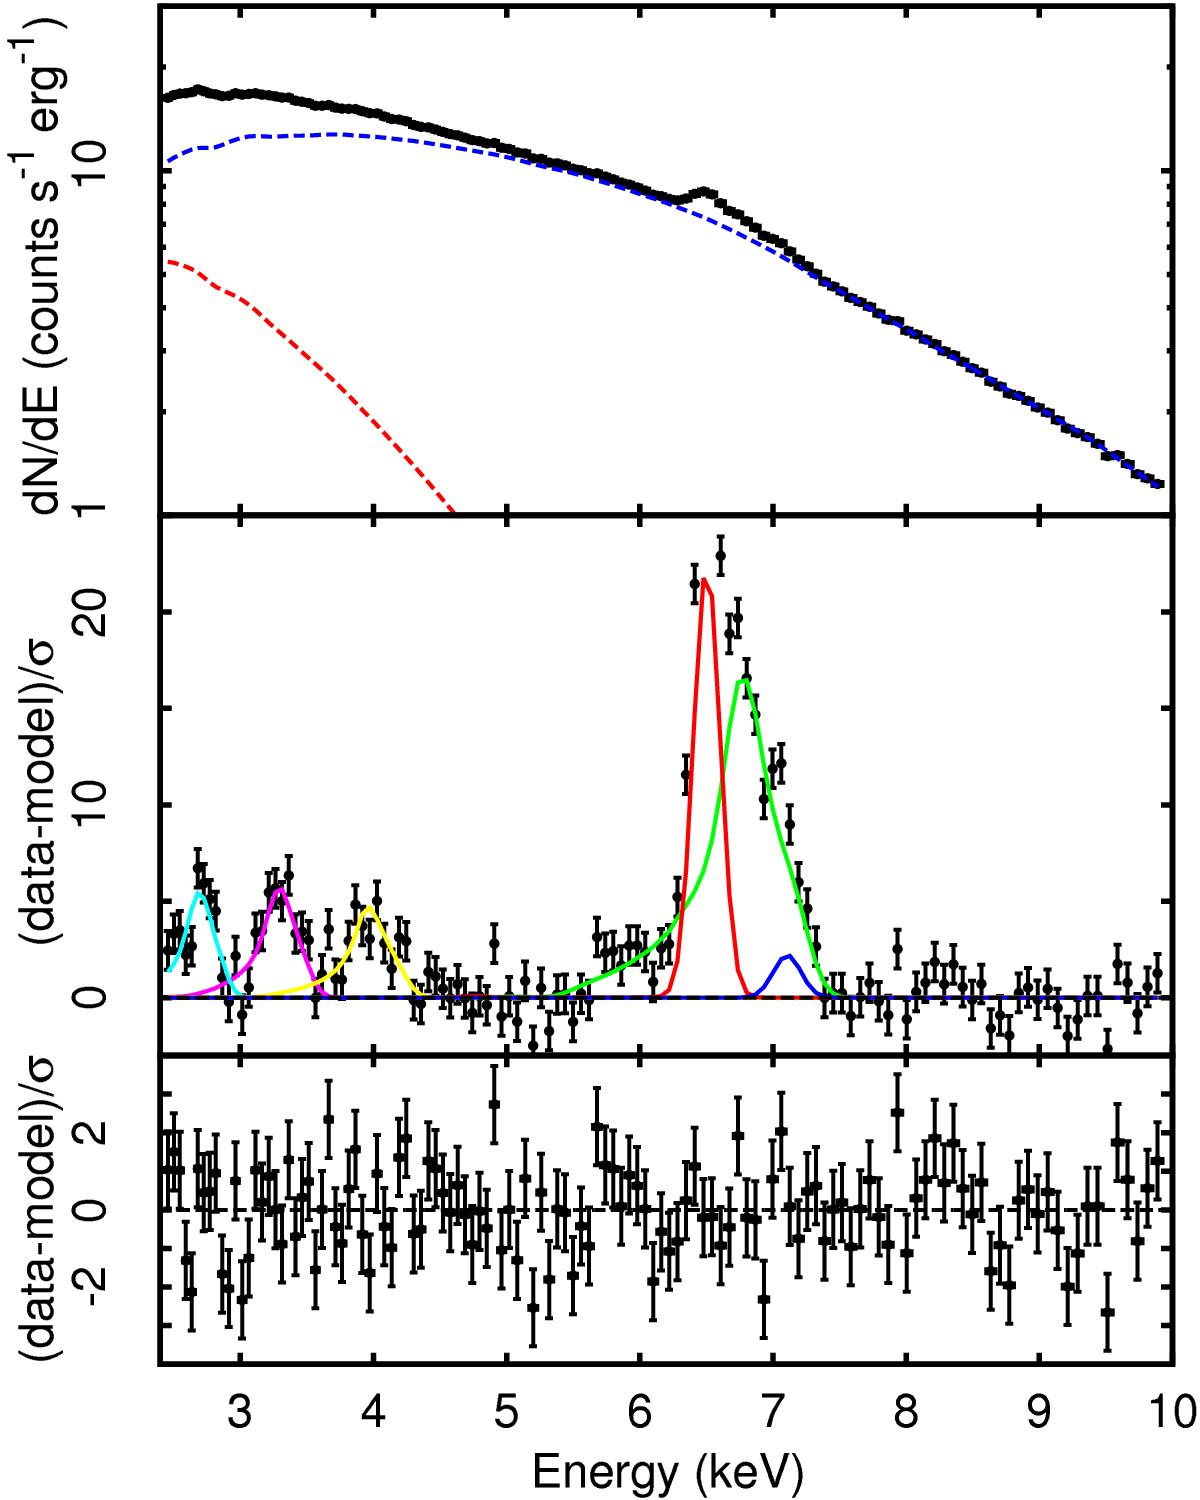
Spectrum observed by the EPIC-pn between 2.4 and 10 keV together with the best-fitting blackbody (red dashed line) and Comptonization (blue dashed line) component of Model II listed in Table 1 (top panel). Residuals obtained when the six emission features at energies E1 = 6.75 keV (green solid line), E2 = 6.48 keV (red solid line), E3 = 7.12 keV (blue solid line), E4 = 2.74 keV (cyan), E5 = 3.30 keV (magenta), and E6 = 3.94 keV(yellow) are removed from Model II (middle panel). The model is not fitted after the line removal, so the residuals are only plotted for illustrative purposes. Residuals left by Model II are plotted in the bottom panel.
Current usage metrics show cumulative count of Article Views (full-text article views including HTML views, PDF and ePub downloads, according to the available data) and Abstracts Views on Vision4Press platform.
Data correspond to usage on the plateform after 2015. The current usage metrics is available 48-96 hours after online publication and is updated daily on week days.
Initial download of the metrics may take a while.