Fig. 9
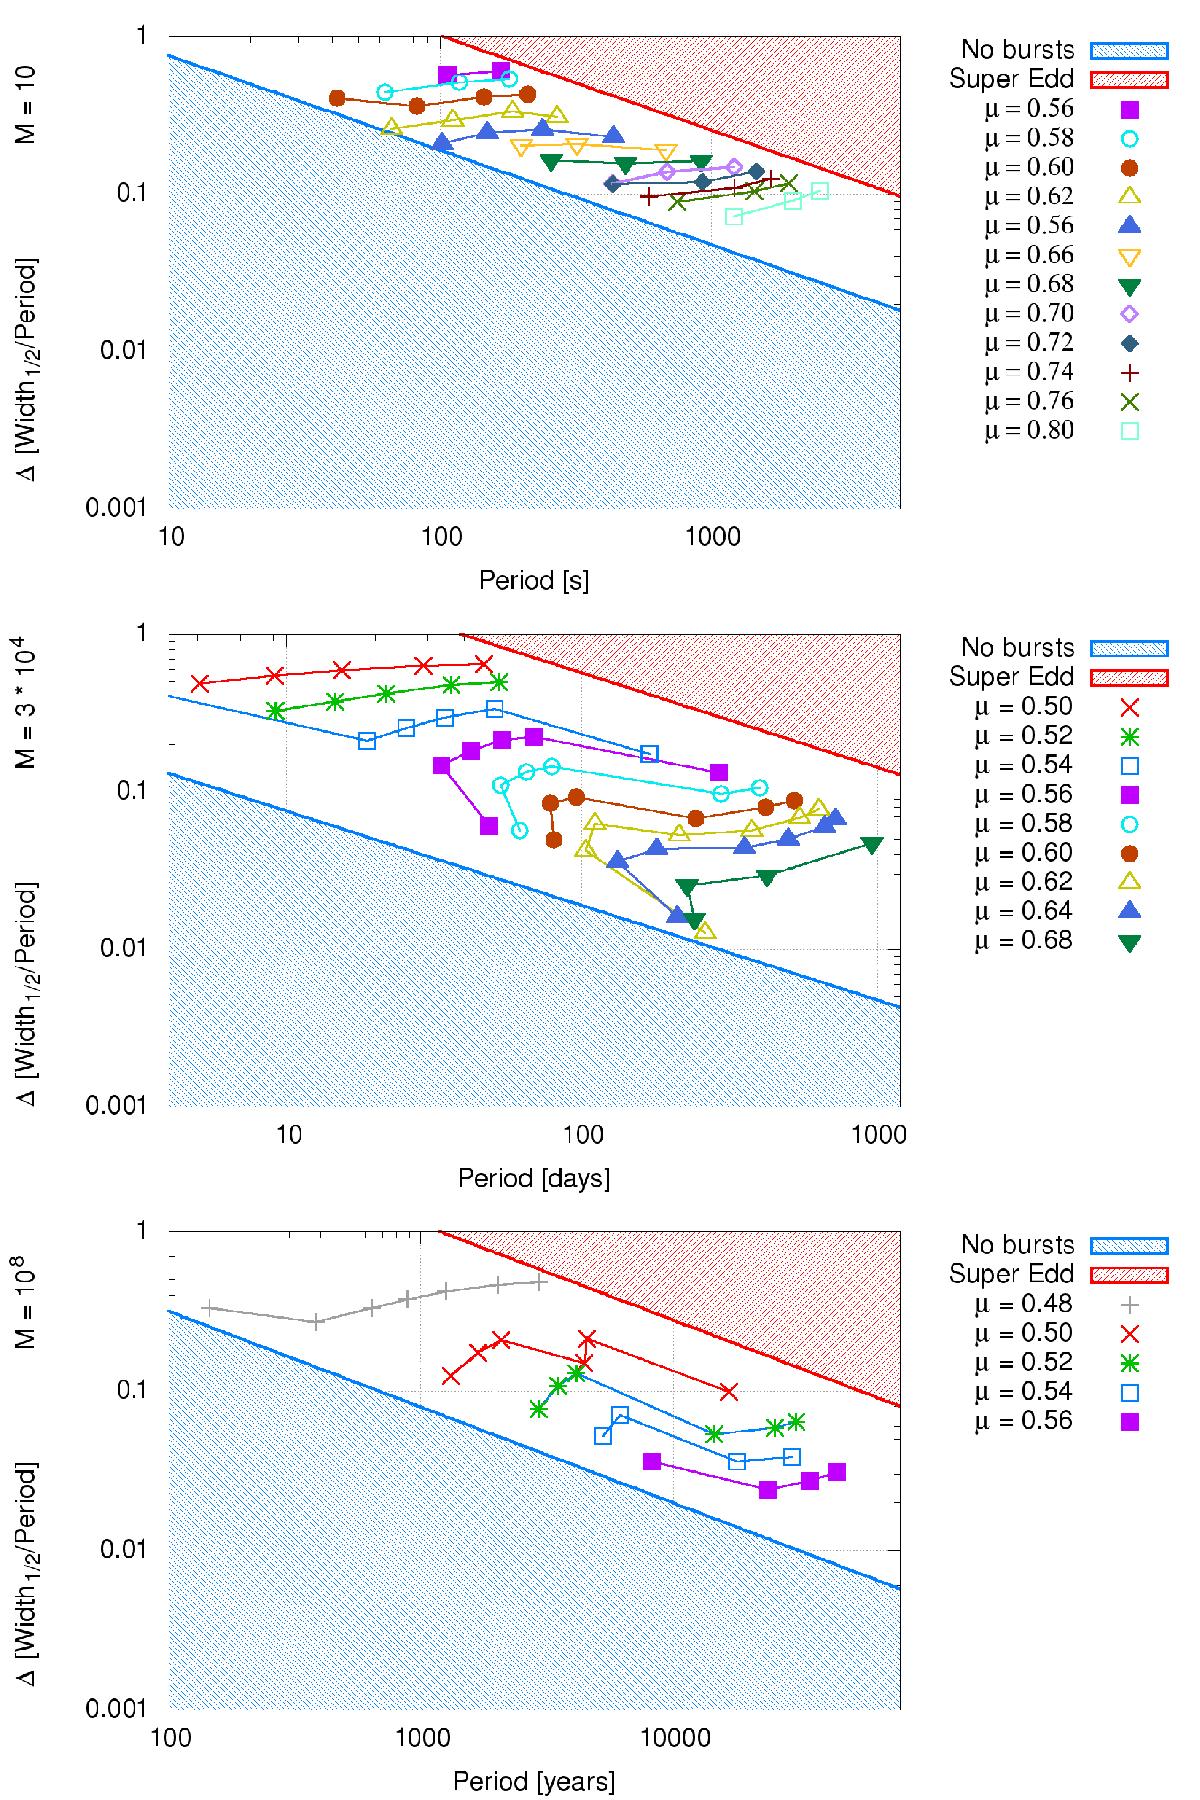
Upper graph: dependence between period and width of flares for a stellar-mass black hole (M = 10 M⊙). The graph was prepared for a range of μ ∈ [ 0.44:0.8 ]. Middle graph: dependence between period and width of flares for an intermediate-mass black hole (M = 3 × 10⁴M⊙). The graph was prepared for a range of μ ∈ [ 0.44:0.8 ]. Lower graph: dependence between period and width of flares for a supermassive black hole (M = 108M⊙). The graph was prepared for a range of μ ∈ [ 0.44:0.56 ]. The colored lines represent isolines for different μ.
Current usage metrics show cumulative count of Article Views (full-text article views including HTML views, PDF and ePub downloads, according to the available data) and Abstracts Views on Vision4Press platform.
Data correspond to usage on the plateform after 2015. The current usage metrics is available 48-96 hours after online publication and is updated daily on week days.
Initial download of the metrics may take a while.