Fig. 3
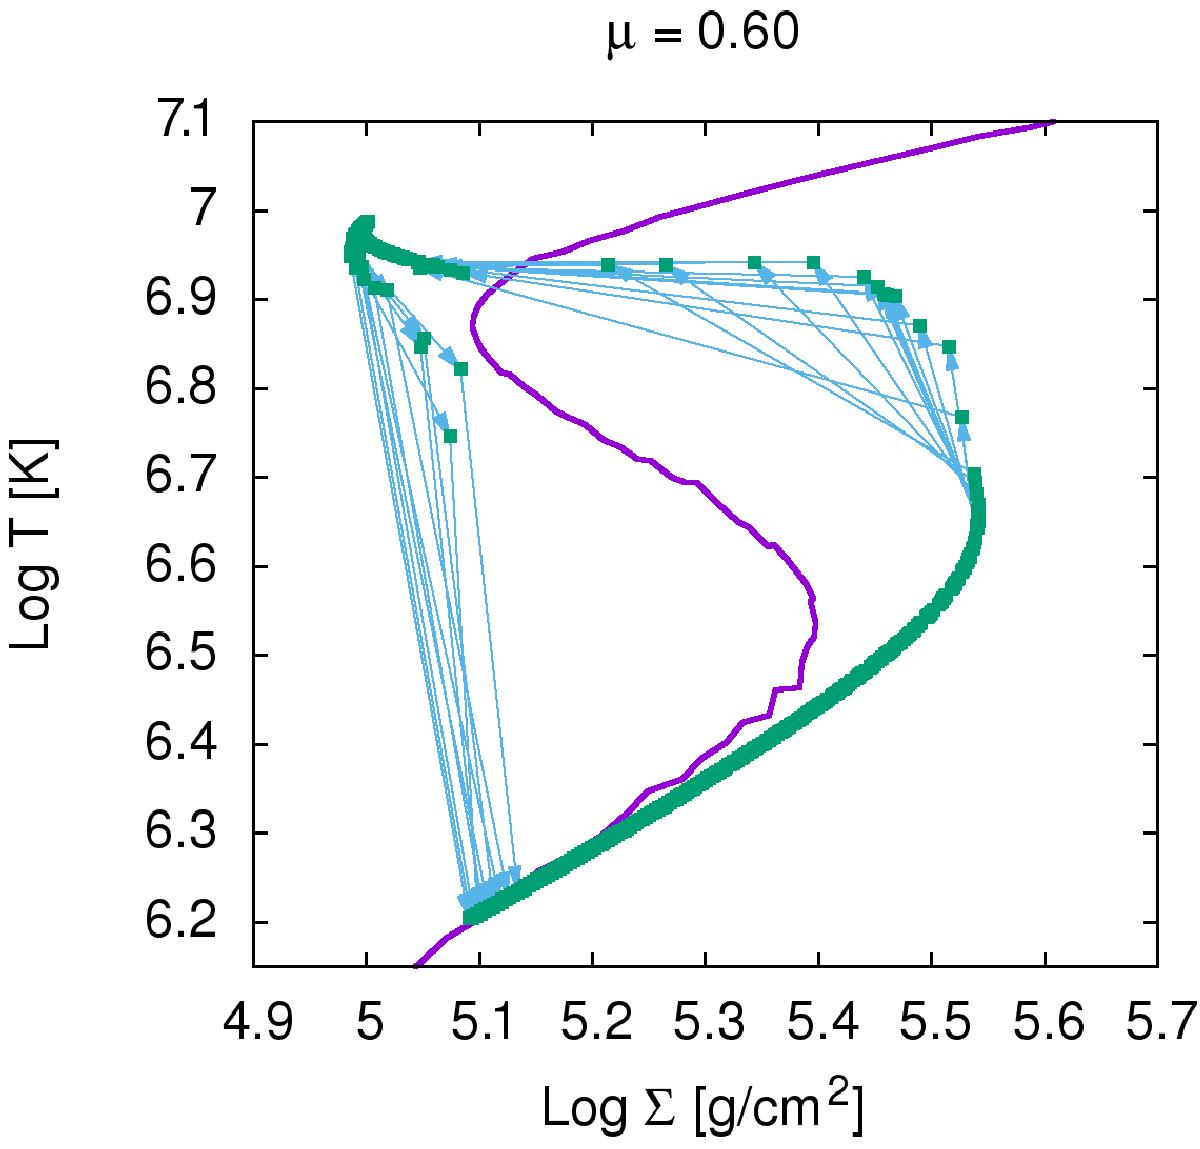
T and Σ variability for the model with μ = 0.6 for a typical IMBH accretion disk. The models present a strongly developed instability, leading to huge outbursts. Parameters: M = 3 × 10⁴M⊙, α = 0.02, and ṁ = 0.25 for the radius ![]() cm. The red curve represents the stationary solution and the green dots show local values of the temperature and density in the dynamical model. The points occupy both the upper and lower branches of the S-curve. Green points represent the most common states of the disk, while blue vectors represent directions of the most common rapid changes of local T and Σ.
cm. The red curve represents the stationary solution and the green dots show local values of the temperature and density in the dynamical model. The points occupy both the upper and lower branches of the S-curve. Green points represent the most common states of the disk, while blue vectors represent directions of the most common rapid changes of local T and Σ.
Current usage metrics show cumulative count of Article Views (full-text article views including HTML views, PDF and ePub downloads, according to the available data) and Abstracts Views on Vision4Press platform.
Data correspond to usage on the plateform after 2015. The current usage metrics is available 48-96 hours after online publication and is updated daily on week days.
Initial download of the metrics may take a while.